


Highlights:
- Ethereum price could soon touch $4,000 after breaking out of a bullish pennant pattern.
- Institutional money is flooding in, with open interest on CME Futures hitting a record $7.85 billion.
- The Rainbow Chart hints ETH may trade between $4,752 and $6,901 in August if momentum holds.
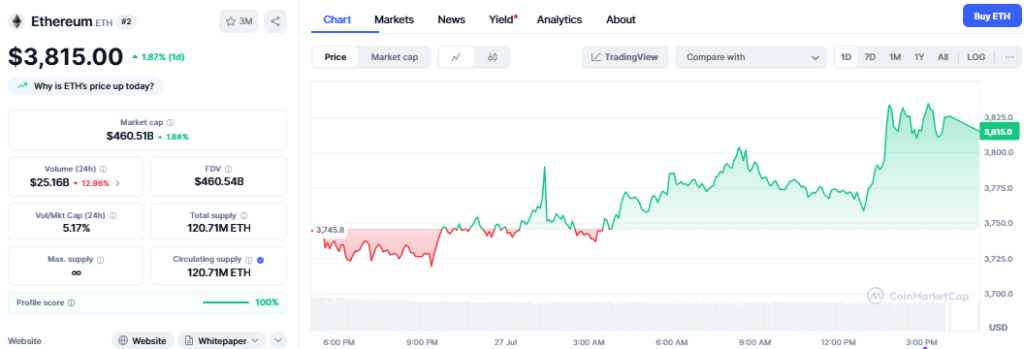
The second-largest cryptocurrency, Ethereum, is trading around $3,815, having surged 1.87% over the past 24 hours. The altcoin has been on a bullish ride recently after recording a 50% gain on the monthly chart. Its market capitalization has climbed to $460 billion despite the 12% decline in 24-hour trading volume to $25 billion.
Advertisement

Ethereum Price Breakout Targets $4,000 Level
Ethereum has been exhibiting indicators of a bullish breakout in the 4-hour chart, according to market analyst ZAYK Charts. The price has risen beyond a pennant setup, which shows a possibility of increased value. The current technical pattern is a continuation pattern and can indicate a strong rise in ETH soon.
$ETH Bullish Pennant Breakout in 4H Timeframe✅
Now,send to +4000$🚀#ETH #ETHUSDT pic.twitter.com/j6KfeYmIuH
— ZAYK Charts (@ZAYKCharts) July 27, 2025
The breakout occurred following some time of consolidation, where the price had been creating converging trend lines. This trend brings about a lapse after which the trend is resumed. The breakout in this case indicates new support and buying strength in the price movement of Ethereum. The breakout could lead to a price increase of about 10.5%, which may push the price of Ethereum beyond $4,000. This estimation is based on the elevation of the pennant pattern with the breakout level.
Ethereum Sees Record Institutional Interest on CME Futures
As noted by market expert Ted on X, the open interest on Ethereum CME futures has reached an unprecedented level of $7.85 billion. This kind of milestone is indicative of a high institutional interest, as opposed to retail investments. Open interest defines the amount of funds involved in future contracts. Currently, Ethereum is experiencing a wave of massive investment, mostly by large financial institutions.
CME is the preferred platform for institutional investors, who are widely viewed as movers of the market. They maintain their strategies to indicate that there was a strong belief in the growth potential of Ethereum. In the past, institutional interest surges usually signaled significant price shifts. Therefore, the Ethereum market may be on the verge of heightened volatility or a powerful surge.
Whales are loading $ETH like never before. 🚀
Ethereum CME Futures Open Interest just smashed to an all-time high of $7.85 BILLION.
That’s the largest institutional positioning ever recorded for $ETH.
Why does it matter?
CME is where Wall Street & big funds play, not retail.… pic.twitter.com/mrteoJ5xMq
— Ted (@TedPillows) July 27, 2025
As Ted points out, major investors do not jump in without thorough analysis. Institutional positions are normally done after a lot of research and risk analysis. Therefore, higher open interest on CME implies that there is a higher conviction in the future of Ethereum instead of speculative activity.
Ethereum’s activity aligns with the wider market trend of institutions increasingly joining the ecosystem. Major players like Bit Digital and SharpLink are continuing to pile up their portfolios, with Ethereum attracting interest in the market.
Ethereum Rainbow Chart Signals Possible Price Levels
According to data provided by the Blockchain Center, the Ethereum Rainbow Chart shows that ETH could fluctuate between $4,752 and $6,901 in August. The price is within the range of the “Steady” zone at present, which means stable growth and fewer fluctuations in price.
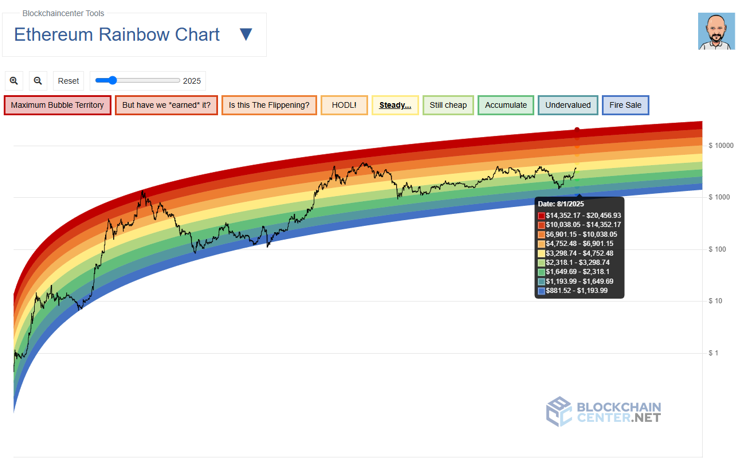
The chart consists of a number of color bands representing various stages of valuation, allowing investors to determine at what point Ethereum could be undervalued or overheated. In addition, the tool presents a long-term valuation framework instead of short-term predictions.
Lower price bands include zones such as “Fire Sale” and “Accumulate,” which are considered favorable for buying. As prices increase, the bands move to bands such as “HODL” where long-term holders tend to feel comfortable. Above this are speculative areas, such as flippifying ones like “Is This the Flippening?” which implies greater market enthusiasm and possible hype.
Technical Analysis: Where is Ethereum Price Heading?
Ethereum continues its upward trend, pushing beyond the $3,800 mark with strong bullish candles. The Relative Strength Index (RSI) shows a value of 81.34, which typically suggests an overbought market condition. Meanwhile, MACD remains bullish, indicated by expanding green histograms and rising signal lines. As a result, Ethereum’s upward momentum might persist briefly.
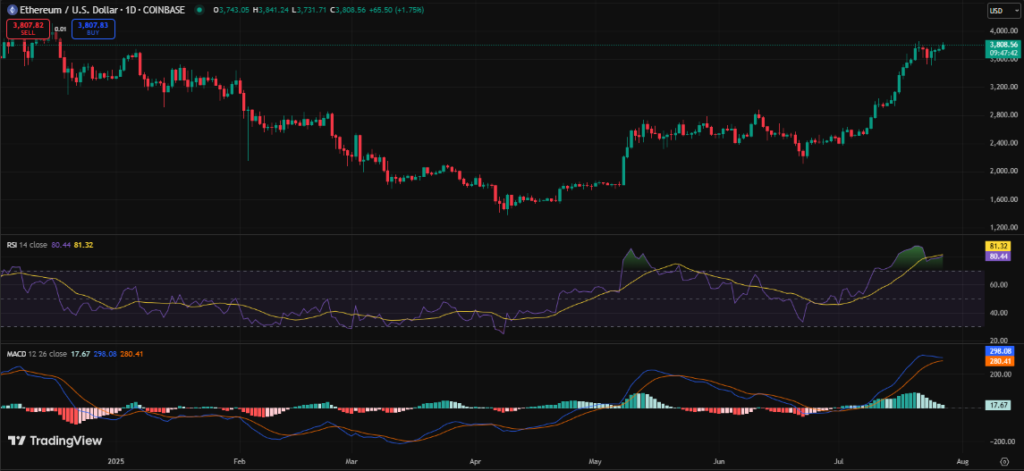
However, traders must consider potential price pullbacks. Given the high RSI, Ethereum could face short-term corrections soon. However, should the current trend hold, Ethereum could climb above the $4k mark, which was last seen in December. Support for Ethereum remains at the $3,500 and $2,900 mark.
![]()
eToro Platform
Best Crypto Exchange
- Over 90 top cryptos to trade
- Regulated by top-tier entities
- User-friendly trading app
- 30+ million users
![]()
eToro is a multi-asset investment platform. The value of your investments may go up or down. Your capital is at risk. Don’t invest unless you’re prepared to lose all the money you invest. This is a high-risk investment, and you should not expect to be protected if something goes wrong.
Advertisement


