


The price of Toncoin has skyrocketed by 5.5% in the last 24 hours to $5.59 as of 4:12 a.m. EST, on a 126% pump in trading volume to $1.9 billion. The market cap is now at $14 billion.
Toncoin price surged following news of Telegram CEO Pavel Durov’s release from custody. Durov had been arrested in France over the weekend on multiple charges, including facilitating illicit transactions on the platform.
Advertisement

The price of $TON is inside a channel and will likely retest the support of $5 before #toncoin bounces up to the $8 resistance area. pic.twitter.com/bxCGzJuO9y
— CryptoJack (@cryptojack) August 29, 2024
Despite the rebound, the overall impact on the token has been limited compared to the panic caused by Durov’s arrest. Over the past few days, there’s been a noticeable increase in the intention to sell among TON holders.
The rise in active deposit metrics indicates that more TON is being moved from investor wallets to exchanges. This trend reflects growing skepticism and bearish sentiment among investors, which has led to increased selling activity.
TON Statistics
- Toncoin price: $5.59
- Market Cap: $14 billion
- Trading volume: $1.9 billion
- Circulating supply: $2.5 billion
- Total supply: 5.1 billion
Toncoin Price Shows a Potential Bully Rally Ahead
The price of the token has been experiencing a downward trend recently caused by the bears, reflecting their strength in the market. This movement has led to the formation of a bearish channel pattern, which shows the likelihood of a bullish reversal. After the token’s price reached the lower trendline of the bearish channel, the bulls took over by forming a support level at $5.11025.
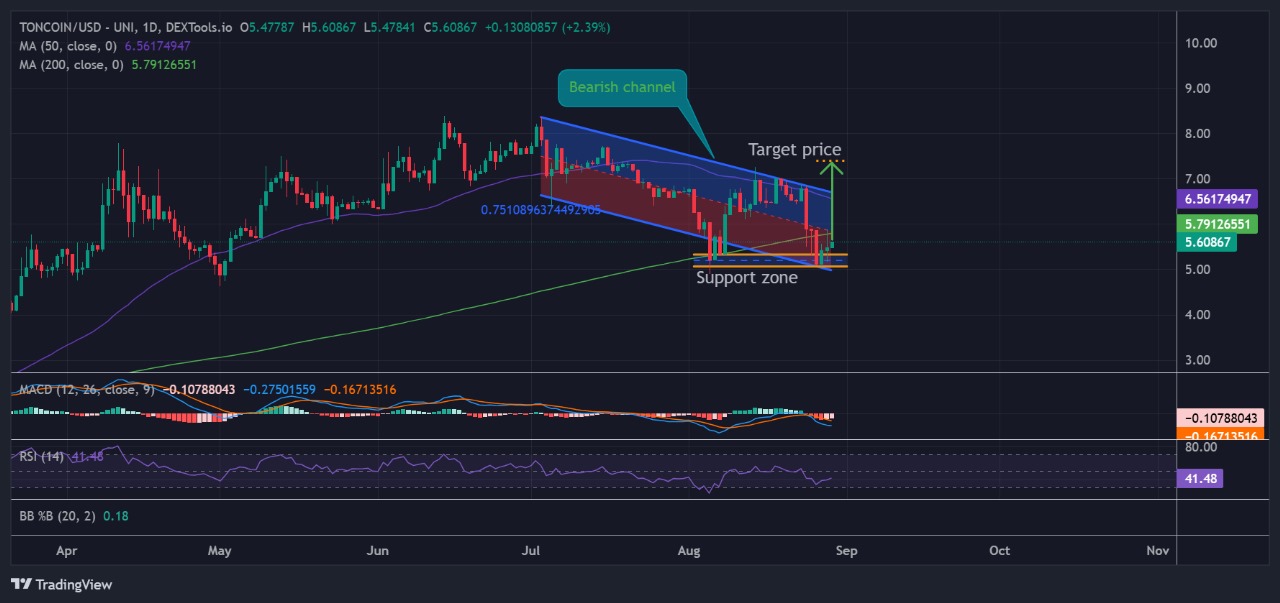
The Toncoin price is currently trading below the 50-day simple moving average (SMA) and 200-day SMA. However, Bulls are pushing the price high so as to surpass the 200-day SMA, which, after surpassing it, will act as a support level of the market, increasing the likelihood of a bully rally to occur.
Moreover, if the bulls continue to be in control, they are more likely to surpass the 50-day SMA, which will increase the possibility of an upcoming bully rally. The relative strength index (RSI) also indicates a possible bullish outlook. The RSI is currently flowing upwards, heading to the 50-midline after the recent spike formed as it was about to break below the 30-oversold level.
The spike formed has shown the strength of the buyers in the market, showing potential for a bullish reversal. Moreover, if the bulls continue with their strategy, the RSI might manage to cross over the 50-midline level, which will increase the probability of a bullish trend.
Additionally, Moving Average convergence divergence (MACD) has also contributed to the suggestion of a bullish crossover. The red histogram bars decrease in size and number as they fade out in color; on the other hand, the blue line of MACD rises to cross the orange signal line, indicating an upcoming bullish rally.
Toncoin Price Prediction
If bulls maintain their momentum, the Toncoin price will surpass both the 50-day and 200-day SMA, which in turn will lead to a bullish breakout at the upper trendline of the bearish channel.
After this scenario, the bulls will aim at a target price of $7.3989, favoring the buyers. On the other hand, if the bears regain control of the market, they might manage to pull the price back to the support level of $5.11025, which would favor the sellers.
Advertisement


