


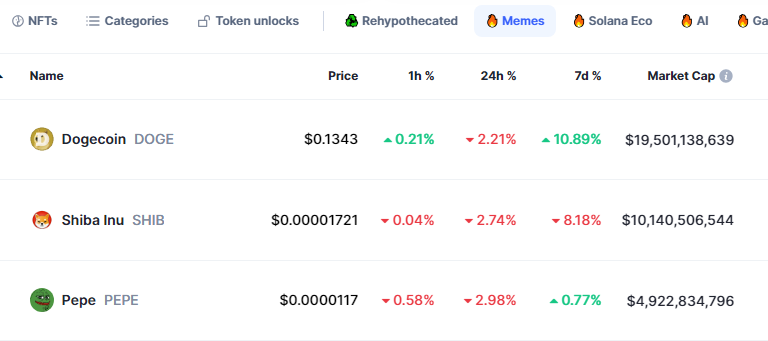
The Dogecoin (DOGE) price is experiencing a sharp decline today as the broader crypto market flashes bearish. Moreover, the broader meme coin market mood mirrors the crypto market outlook, which is bleeding red. The Dogecoin price has tumbled 2% in the past 24 hours, with the DOGE/USD trading at $0.1337. Notably, its trading volume has dived 2% to $1.36 billion, suggesting a fall in market activity.
This comes as the broader meme coin market has dived in the past 24 hours, mirroring the King of Crytpos (BTC), which is down almost 1%. Dogecoin’s market cap exceeds $19 billion, along with SHIB and PEPE, which have a market cap of $10 billion and $4 billion, respectively.
Advertisement

Meanwhile, Trader Tardigrade, a well-regarded crypto trader, has injected fresh optimism into the DOGE community. He has mentioned that a bull rally is expected if the coin surges back to resistance levels.
$DOGE has completed the "Spring" in Wyckoff Pattern 🔥
If it surges back to the resistance levels, it could be a very well structured Re-accumulation form. A Bull Rally is expected.🚀 pic.twitter.com/zAUIbPzSg8— Trader Tardigrade (@TATrader_Alan) July 22, 2024
Dogecoin Statistical Data
Based on Coinmarketcap data:
- DOGE price now – $0.1337
- DOGE market cap – $19.42 billion
- DOGE total supply – 145.23 billion
- DOGE circulating supply – 145.23 billion
- DOGE ranking – #8
Dogecoin Price Trades Within a Rising Channel as Bulls Attempt a Recovery
The DOGE memecoin is leading in the meme market today. However, the crypto market has a slight pullback, led by the king of cryptos, Bitcoin (BTC). On July 22, the Dogecoin price attempted to rally; however, it faced resistance at $0.1429, forcing the price to drop. Currently, the DOGE token is trading with a bullish bias within the confines of a rising channel in a four-hour timeframe.
Diving into the technical outlook, the DOGE price trades well above the 50-day and 200-day Simple Moving Averages (SMAs). Moreover, the Moving Averages have made a golden cross at around $0.1187. A golden cross is an index on the chart when a short-term moving average flips above a long-term moving average, compelling the market participants that the path with the least resistance is to the upside.
In such a scenario, the $0.1271 and $0.1193(50-day and 200-day) levels act as immediate support keys in the market.
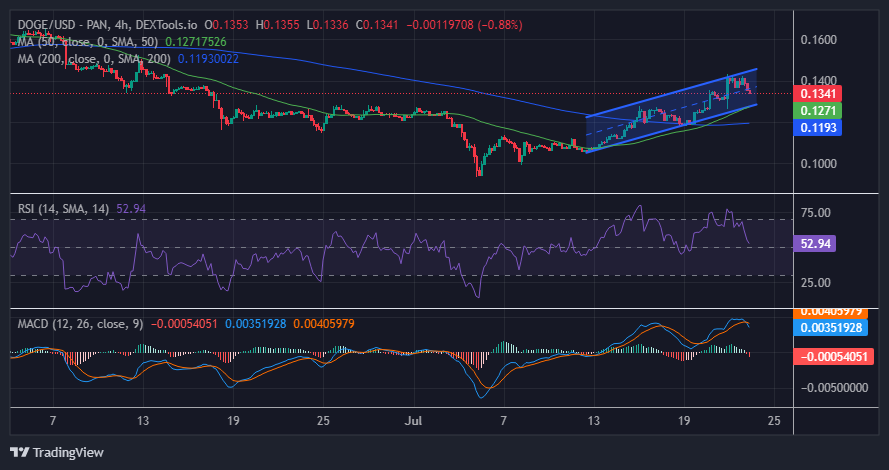
In the same way, the Relative Strength Index (RSI) reinforces the bullish picture, with its strength at 52. If the buyers capitalize on the DOGE market, the RSI could jump toward the 70-overbought zone. However, with the RSI indicator pointing south, the RSI could continue with the downtrend, hurtling towards the 30-overold region.
On the other hand, the Moving Average Convergence Divergence (MACD) signal(blue) has crossed below the signal line (orange band). This crossing suggests that the short-term moving average falls faster than the long-term moving average. Moreover, traders always consider this shift as a selling signal unless the MACD changes.
Will the Bulls Breakout?
In the 4-hour chart analysis, if the bulls play their cards well, they might propel the price above the upper trendline of the governing pattern. If the bulls capitalize on the golden cross at around $0.1187, they could rally above the resistance key at $0.1429. In such a case, increased buying appetite could see the DOGE price rally to around $0.1657 in the next 24 hours.
On the flip side, the DOGE price could drop if the bears step in and capitalize on the MACD that shifted from bullish to bearish. In such a scenario, the Dogecoin price could breach the lower trendline, invalidating the bullish thesis. The DOGE price could slip to around $0.1245. In a dire case, the price could plunge, retesting $0.1193, which coincides with the 200-day SMA.
Advertisement


