
In the past 24 hours, Solana’s price has taken a sharp hit, dropping over 4% and falling below the critical $160 mark to trade at $143. This decline has also impacted Solana’s market cap, which now stands at approximately $66.85 billion.
🔴UPDATE: #Cryptocurrency Price 📉
📌June 17, 2024👇#Crypto #Blockchain #Bitcoin #Ethereum #Binance #Solana #STETH #XRP pic.twitter.com/948tiQZozCAdvertisement
— DeFi Overview🐧 (@DefiOverview) June 17, 2024

Solana has seen a steep decline of over 50% from its peak in March this year. However, recent developments hint at a potential turnaround. At the same time, its open interest has increased by 0.36%, accompanied by a significant 68% surge in open interest volume, now valued at $3.83 billion.
Solana comparatively holding the triangular support area. $SOL
If it breaks below 140$, expect price again near 125$ or below (red box area) pic.twitter.com/kFDvrOedpp
— Open4profit (@open4profit) June 17, 2024
However, despite the price drop, there’s been a surge in market activity, with Solana’s 24-hour trading volume skyrocketing 74% to $2 billion. This comes after PayPal integrated the PYSUSD stablecoin into the SOL DeFi ecosystem!
Moreover, the decrease in active addresses, dropping from over 950,000 to 902,000 in the past week, suggests reduced network activity. There are signs that market sentiment could be changing.
The Solana Price Bulls Could Rebound On A Double Bottom Structure
Solana experienced a brief period of price stability, but it was short-lived as bearish sentiment quickly overtook the market. Solana’s price dropped significantly within a short period, highlighting its strong bearish momentum. The price initially fell to a critical support level of around $157.
However, it has since broken below this support, dropping further to $142, nearing the lower boundary of the descending wedge formation and forming a double bottom pattern, which traders look to for bullish reversal signals.
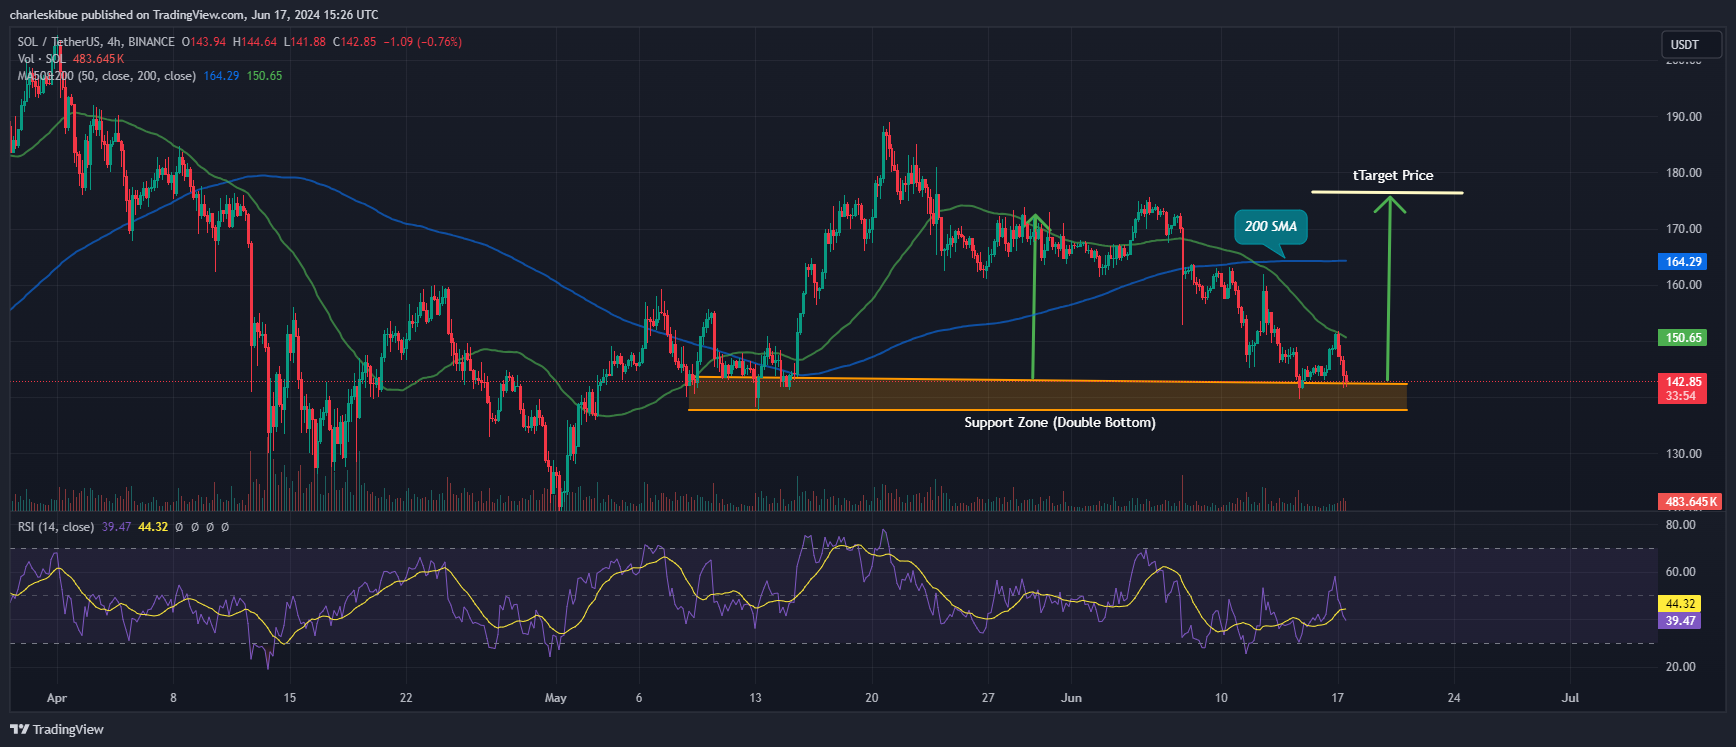
SOLUSD Chart Analysis (Source: Tradingview)
Solana’s price has dropped below both the 50-day and 200-day Simple Moving Averages (SMA), with the 50 SMA now acting as an immediate barrier to any upward movement. This shift indicates a momentum favoring the downside. However, if the broader market sentiment responds to the double-bottom pattern and turns bullish, bulls could drive the price back above both SMAs. This would signal a potential for a strong bullish rally.
The Relative Strength Index (RSI) also reflects a downward trend, currently hovering around the 38 mark, below the neutral level of 50. This suggests that selling pressure may be easing. If bullish momentum strengthens, the RSI could climb higher, possibly entering the overbought territory above 70. Such a move would indicate increased buying interest and further support Solana’s bullish scenario.
The MACD (Moving Average Convergence Divergence) indicator indicates a bearish trend. Recently, the blue average line crossed below the orange signal line around the neutral level, signaling a move towards bearish momentum. Moreover, the histogram bars show negative momentum in the price movement, adding to the bearish outlook.
The Solana Price Bulls Ready On For Another Bull Rally
Even though Solana’s price has fallen from the $175 consolidation level and is currently trading below the 50 SMA, there’s still an upward trend in sight. The bullish momentum in SOL price could potentially push it back to around $205 in the weeks ahead.
However, if the bears continue to dominate below the 50 SMA, the bullish momentum might weaken, and the price could retreat towards the $126 support level.
Read More
- Solana Price Prediction 2024 – 2030
- David Hirsch Resigns as Head of SEC’s Crypto Unit After Nearly a Decade
- 20 Top Cryptocurrencies to Watch for 2024 – Detailed Reviews
- Next Cryptocurrency to Explode in 2024
Disclaimer: Cryptocurrency is a high-risk asset class. This article is provided for informational purposes and does not constitute investment advice. You could lose all of your capital.


Advertisement