XRP Price Spikes 8% Amid BlackRock ETF Speculation as Bulls Eye $3


Highlights:
- XRP price surged 8% to $2.64 amidst U.S. National Bank license rumors.
- BlackRock may soon apply for XRP ETF, potentially bringing $8B in capital.
- XRP shows bullish rally potential, with a possible price surge to $3.
The XRP price has surged in the cryptocurrency realm, rising 8% to $2.64 in the past 24 hours. There have been rumors circulating that several sources have confirmed the U.S. National Bank is about to receive the green light for Ripple’s license. This news can cause shivers to run through the cryptocurrency and financial arenas, more so in XRP. If approved, this could cause a rally in XRP price to $5.
Advertisement

💥 RUMOR:
MULTIPLE SOURCES REPORT RIPPLE’S U.S. NATIONAL BANK LICENSE SET FOR APPROVAL TODAY.$XRP COULD HIT $5 INSTANTLY IF APPROVED! pic.twitter.com/SQcCWCdtju
— Maxi (@Maxi_Dec2020) July 11, 2025
On the other hand, BlackRock may soon apply to be listed in a spot XRP ETF (exchange-traded fund). Most crypto analysts believe that an XRP ETF would generate a capital inflow of over $8 billion if it were approved. Meanwhile, the Ripple-SEC case entered its final procedural phase, where the parties appeared in court to address outstanding appeals.
XRP Market Flashes Bullish Rally to $3 Soon
The XRP market is already demonstrating a tendency to fluctuate significantly. According to the XRP Exchange Liquidation Map, XRP has been in high demand, particularly among those holding long positions. The table highlights the total liquidation on both the short and long sides. As of this writing, the current average price of XRP is $2.64.
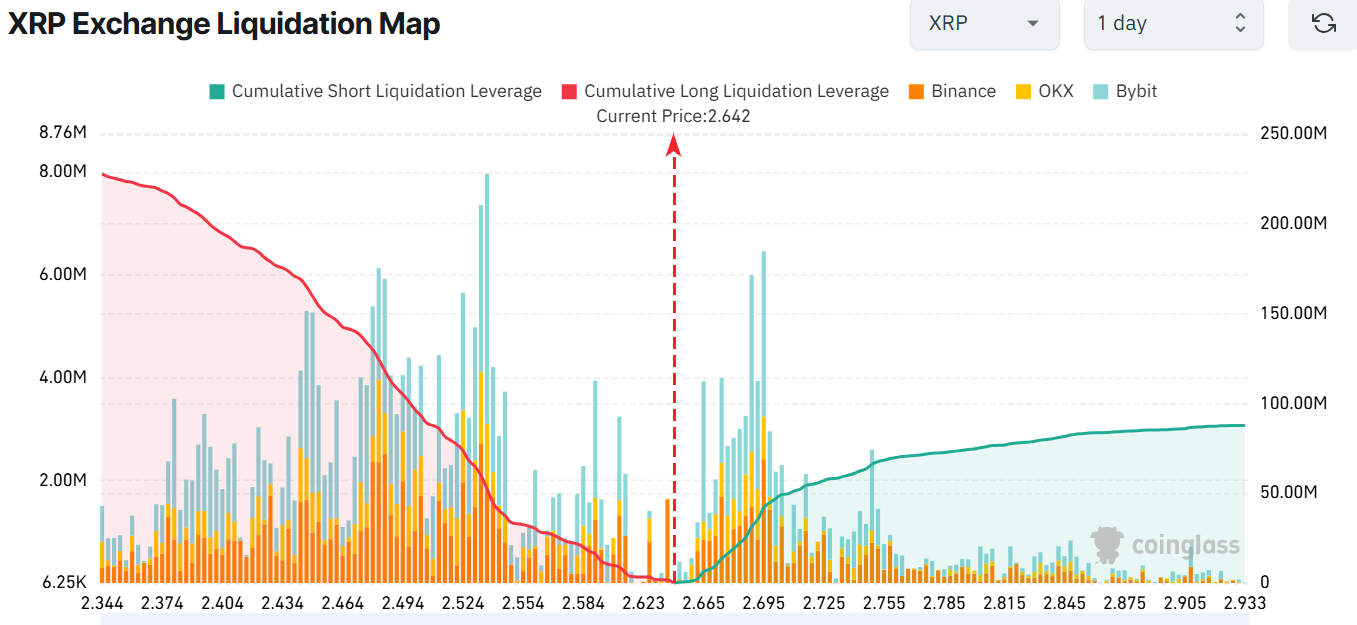
The position of long liquidation leverage ($227.86 million) is significantly higher than that of short liquidations ($87.79 million). This implies that there could be a sudden surge in the XRP price to higher levels, potentially $3. This imbalance suggests a high likelihood of a short squeeze, which could lead to a faster appreciation of the XRP price.
Besides the XRP Exchange Liquidation Map, the technical analysis of the XRP price chart also confirms the story of a possible breakout. The chart displays a rounding bottom, a typical bull market technical pattern that indicates a potential price breakout following a period of consolidation. Moreover, the bulls have established strong support at the 50-day MA at $2.22 and the 200-day MA at $2.36.
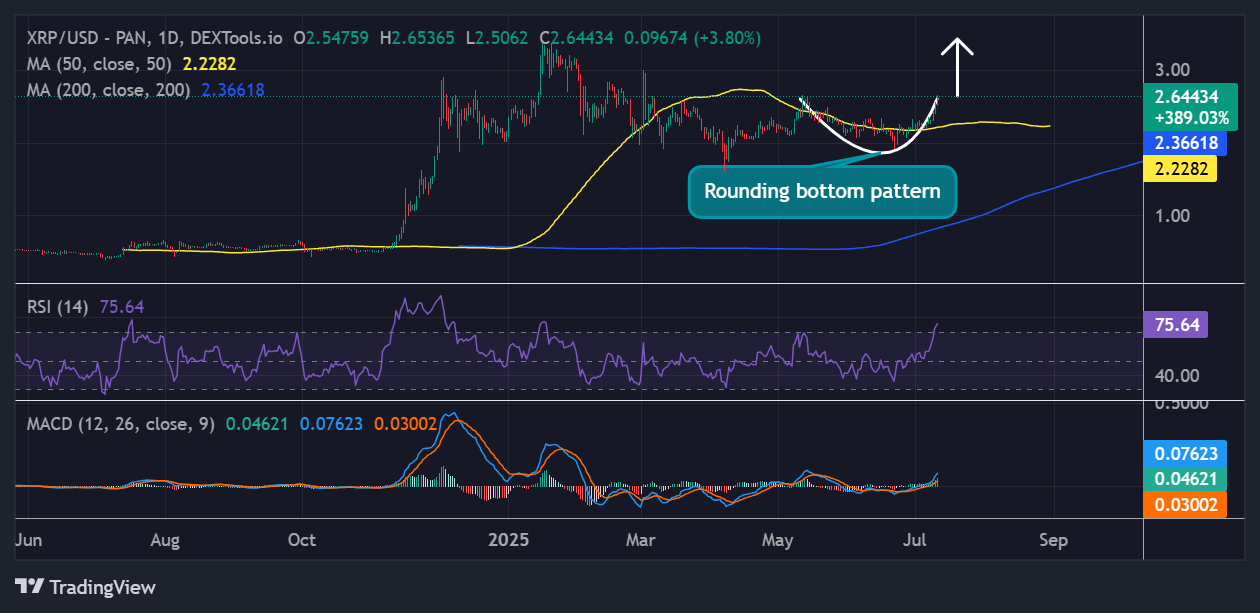
This trend, coupled with the Relative Strength Index (RSI) at 75.64, indicates that XRP is flirting around the overbought region. This means that traders should be cautious to avoid a bull trap. However, if the $2.65 zone holds, further upside could be imminent towards $3.
Additionally, the Moving Average Convergence Divergence (MACD) is bullish, as the blue MACD line crosses above the orange signal line, indicating a bullish crossover. It is also noticeable that the green bars on the histogram have also begun increasing. This may be an indication that building positive momentum may occur.
XRP Price $3.42 Level
Based on the XRP 1-day chart outlook, the bulls have put their best foot forward, aiming for the $3 level. If the positive indicators continue to form and the support zones hold, the XRP price could reach $2.96-$3 in the next 48 hours. However, with the RSI nearing overbought, a breather might be due. In such a case, the $2.55-$2.40 range will serve as a safety net. In the long term, the XRP price may test $3.4-$5 by the end of the year, provided the conviction holds.
![]()
eToro Platform
Best Crypto Exchange
- Over 90 top cryptos to trade
- Regulated by top-tier entities
- User-friendly trading app
- 30+ million users
![]()
eToro is a multi-asset investment platform. The value of your investments may go up or down. Your capital is at risk. Don’t invest unless you’re prepared to lose all the money you invest. This is a high-risk investment, and you should not expect to be protected if something goes wrong.
Advertisement


Emmaculate Araka
Emmaculate Araka is a cryptocurrency writer with published works on Crypto2Community and other news sources. She is believer in the transformative power of crypto and the blockchain industry, conducting on-chain analysis, breaking down market-triggering events, and helping traders and investors benefit from expert technical price analysis. Emmaculate finds gratification in diving deep into the crypto space, earning herself significant knowledge and experience. She holds a Bsc. in Information Science, and outside work, Emmaculate loves reading novels and watching documentaries.
View full profile ›ℹ️About Crypto2Community's Editorial Process
Crypto2Community's editorial policy is centered on delivering thoroughly researched, accurate, and unbiased content. We uphold strict editorial policy and sourcing standards, and each page undergoes diligent review by our team of top crypto industry experts and seasoned editors. This process ensures the integrity, relevance, and value of our content for our readers.