XRP Price Slips 5% as the US PPI Rises to $3.3% Higher Than Expected


Highlights:
- XRP price drops 5% to $3.10 despite the trading volume soaring 29%.
- The recent drop comes as the US PPI rose to 3.3%, higher than expected.
- Technical indicators flash bearish as bulls attempt to gain stamina.
The cryptomarket has seen a slight drop, as XRP price has plummeted 5% to $3.10. Despite the drop, its daily trading volume has spiked 29% to $11.49 billion, indicating growing market momentum. The recent fall comes as the US PPI rose to 3.3%, higher than expectations of 2.5%.
Advertisement

HOLY CRAP!
This is Really bad for Inflation:
The US PPI numbers are out and they're MUCH higher than expected! Headline PPI YoY: 3.3% (exp 2.5%, prev 2.3%).
Now let me explain why this is so terrible for inflation.
PPI = Producer Price Index. It's basically the wholesale… pic.twitter.com/82tinn8qnz
— Brian Krassenstein (@krassenstein) August 14, 2025
Meanwhile, Ali Martinez says that whales have purchased a huge amount of XRP (320 million) during the past 72 hours. The whale movement has helped in exerting a visible increase in the price of the coin. To this date, the XRP is selling stronger than it has in the past few weeks, which has been facilitated by this huge buy-in.
320 million $XRP bought by whales in the last 72 hours! pic.twitter.com/i1Hx6qNKMq
— Ali (@ali_charts) August 13, 2025
On the other hand, the XRP derivatives market data shows some mixed signals. The information shows that the trading volume has increased by 38.82% to $15.93 billion. Nonetheless, the open interest has reduced by 6.81% to $8.08 billion. This signals that although investors trade actively with the coin, some traders might lack the confidence to trade a long-term position because of market fluctuation. Nonetheless, this has not dampened the options market that has exhibited a healthy growth as the options volume increased by 143.07%, with the options open interest steep rise of 57.15%.
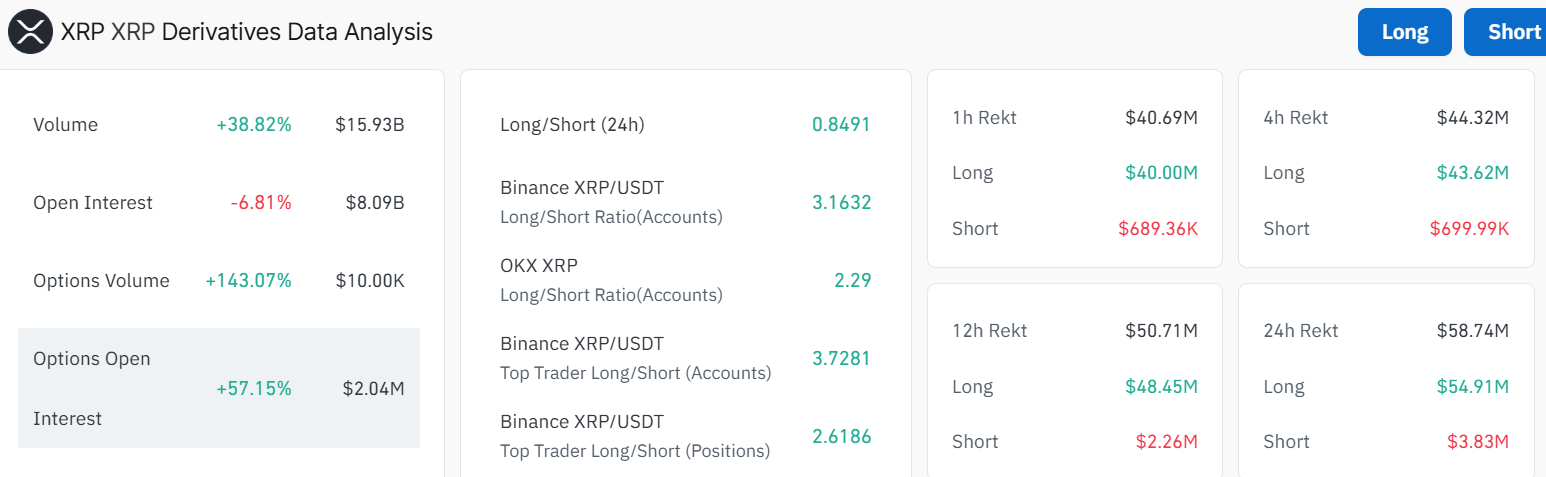
Notably, the short positions are currently experiencing huge losses in the market, as demonstrated in the data. Liquidation of $58.74 million has been recorded in the market in the past 24 hours alone, of which the short positions(3.83 million) accounted for most of the losses.
XRP Price Moves Into a Consolidation Channel
The XRP price 4-hour chart outlook flashes a bearish signal, as the cross-border payment token moves into a consolidation phase. The token has plunged below key support zones, tilting the odds towards the bears. Currently, the beras have established immediate resistance zones around the 50-day ($3.19) and 200-day ($3.15) SMA. This bearish stance comes as the U.S. PPI report comes in more than expected.
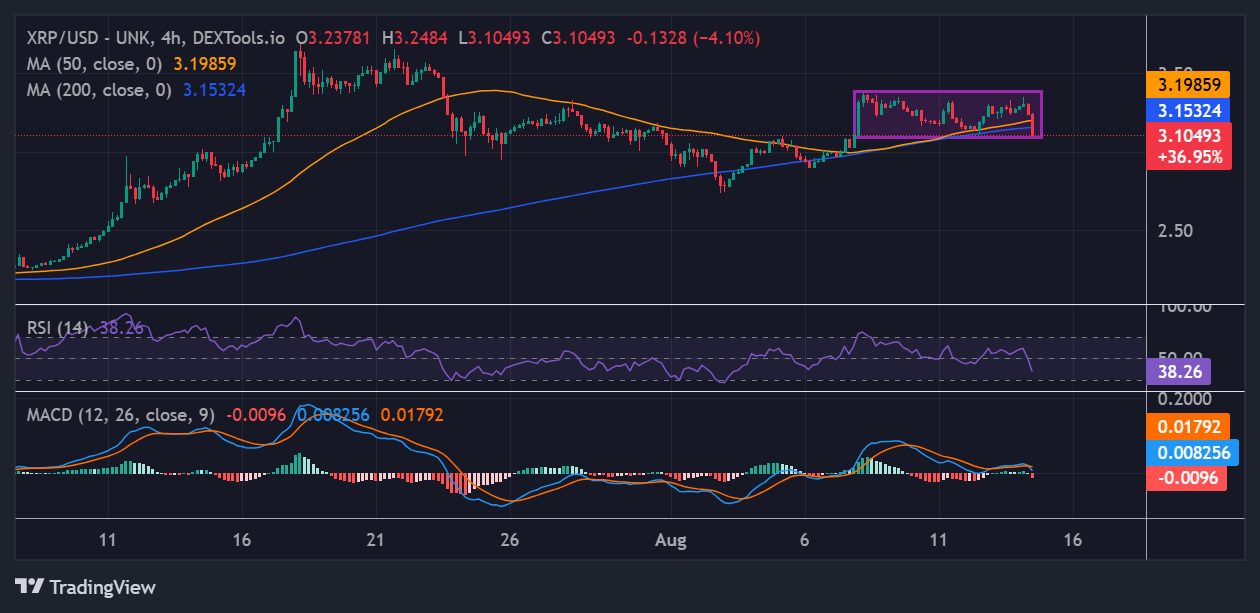
Looking at indicators, the Relative Strength Index (RSI) is at 38.26, signalling a bearish grip. Its position below the 50-mean level indicates that the selling pressure is intense, and may move the token towards the oversold region. The Moving Average Convergence Divergence (MACD) shows a bearish crossover, with the MACD line (blue)(0.00825) edging below the signal line(0.01792). This combination signals mixed momentum, which may result in an extended consolidation around this level or further downside.
Can the XRP Bulls Regain Momentum Soon?
Currently, the $3.19 level (50-day SMA) with $3.15 (200-day SMA) serves as the resistance zone. If the bulls regain momentum and overcome the above levels, the next resistance at $3.29 could flip to support, opening the door to $3.60. Conversely, if bears keep dominating, a drop below $3.02 could lead to a test of the $2.90 mark. In the short term, XRP price needs to overcome the key resistance zones to open the doors for an upward movement.
![]()
eToro Platform
Best Crypto Exchange
- Over 90 top cryptos to trade
- Regulated by top-tier entities
- User-friendly trading app
- 30+ million users
![]()
eToro is a multi-asset investment platform. The value of your investments may go up or down. Your capital is at risk. Don’t invest unless you’re prepared to lose all the money you invest. This is a high-risk investment, and you should not expect to be protected if something goes wrong.
Advertisement


Emmaculate Araka
Emmaculate Araka is a cryptocurrency writer with published works on Crypto2Community and other news sources. She is believer in the transformative power of crypto and the blockchain industry, conducting on-chain analysis, breaking down market-triggering events, and helping traders and investors benefit from expert technical price analysis. Emmaculate finds gratification in diving deep into the crypto space, earning herself significant knowledge and experience. She holds a Bsc. in Information Science, and outside work, Emmaculate loves reading novels and watching documentaries.
View full profile ›ℹ️About Crypto2Community's Editorial Process
Crypto2Community's editorial policy is centered on delivering thoroughly researched, accurate, and unbiased content. We uphold strict editorial policy and sourcing standards, and each page undergoes diligent review by our team of top crypto industry experts and seasoned editors. This process ensures the integrity, relevance, and value of our content for our readers.