

Highlights:
- XRP price pumps 14% to trade at $1.62 at investor interest bolsters.
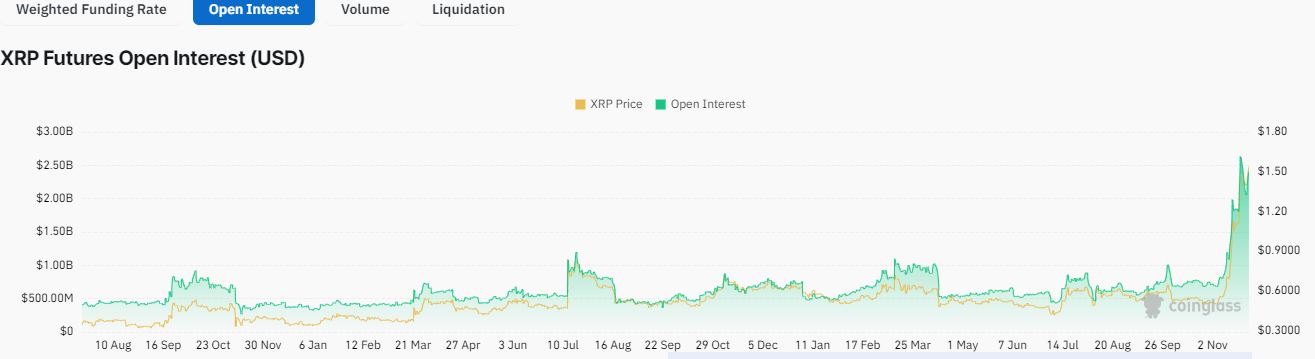
- Coinglass data shows a rise in volume and open interest, signaling a bullish rally ahead.
- RSI shows overbought, but MACD signals bullish momentum.
The XRP price is winning on the charts today as some bullish prospects in the market continue to flash. The Ripple token has elevated 14% at the time of writing to trade at $1.62. Its daily trading volume is notably up 31% to $8.67 billion, suggesting heightened market activity. The XRP price has now elevated by 18% in a week, 212% in a month, and 170% in a year.
Advertisement

The price of XRP has doubled in one week, driven by strong momentum and investor interest in the broader market. Analysts forecast the altcoin could reach $2 in the short term, defying conventional wisdom with a symmetrical triangle that has flipped bullish.
🚨XRP charts to breakout towards $2.98 in next coming hours. #xrp pic.twitter.com/GomLK11t0f
— CryptoGeek (@CryptoGeekNews) November 29, 2024
The spiking interest in XRP has seen the market cap surge by 14%, hitting $93.09 billion. Meanwhile, recent indications hint that the Ripple token is setting up for a significant rally soon. Coinglass data shows rising open interest and volume in the XRP market, suggesting new money flows into the market.
XRP Statistical Data
Based on CoinmarketCap data:
- XRP price now – $1.63
- Trading volume (24h) – $8.67 billion
- Market cap – $93.09 billion
- Total supply – 99.99 billion
- Circulating supply – 57.05 billion
- XRP ranking – #6
XRP Price Trades Above Support Levels – Is a Rally Imminent?
The sleeping giant XRP is printing green candlesticks on the market after breaking out of a long consolidation. Currently trading at $1.62, it is still down 51% from its ATH of $3.18, which was last reached in January 2018 but has been up over 200% in the past month. The XRP price has broken out in a parabolic movement tilting the odds in favour of the bulls.
Further, the Golden Cross in the market cements the long-term bullish outlook. Golden Cross often comes into play when the short-term MA (50-day) crosses above the long-term (200-day) MA. The 50-day MA, positioned at $0.77, provides dynamic support, and the long-term (200-day) MA is at $0.59. The XRP price trades well above both MAs, indicating sustainable bullish momentum.
The RSI has hurtled above the 50-mean level, bolstering the bullish picture. It has soared, almost hitting the 90-strength level, currently at 87.25. Its position above the 70-overbought region suggests a correction is imminent in the market. That said, it is prudent to watch out for the RSI’s rejection from the overbought region to time the reversal carefully to avoid the bull trap.
XRP Price Could Rally to $2 Soon
The Moving Average Convergence Divergence (MACD) is also in positive territory, pulling away from the sell signal. This indicates that buying momentum exceeds selling pressure. Moreover, bulls could seize the opportunity to push the XRP price to $2 if the support levels hold intact.
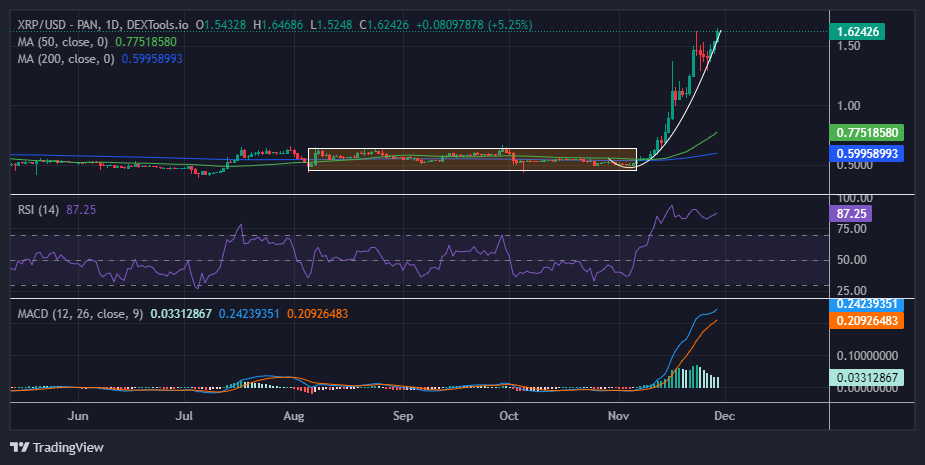
On the flip side, traders should be prepared for a possible pullback or consolidation phase, as overbought conditions on the RSI suggest the market may need a cooling off. In such a case, a slight pullback may cause the XRP price to chase the $1.24 support level as the bulls sweep through liquidity. Increased selling pressure will cause the altcoin to retest the $1.05 support level before a substantial leg up.
![]()
eToro Platform
Best Crypto Exchange
- Over 90 top cryptos to trade
- Regulated by top-tier entities
- User-friendly trading app
- 30+ million users
![]()
eToro is a multi-asset investment platform. The value of your investments may go up or down. Your capital is at risk. Don’t invest unless you’re prepared to lose all the money you invest. This is a high-risk investment and you should not expect to be protected if something goes wrong.
Advertisement


