XRP Price Outlook: XRP Risks Further Downside to $2.02 as Selling Pressure Mounts

Cryptocurrency trading is speculative and your capital is at risk when you trade. We may earn affiliate commissions from some of the products on this page - at no extra cost to you.

Highlights:
- The XRP price has slipped 6% to $2.19 as early profiteering dominates the crypto market.
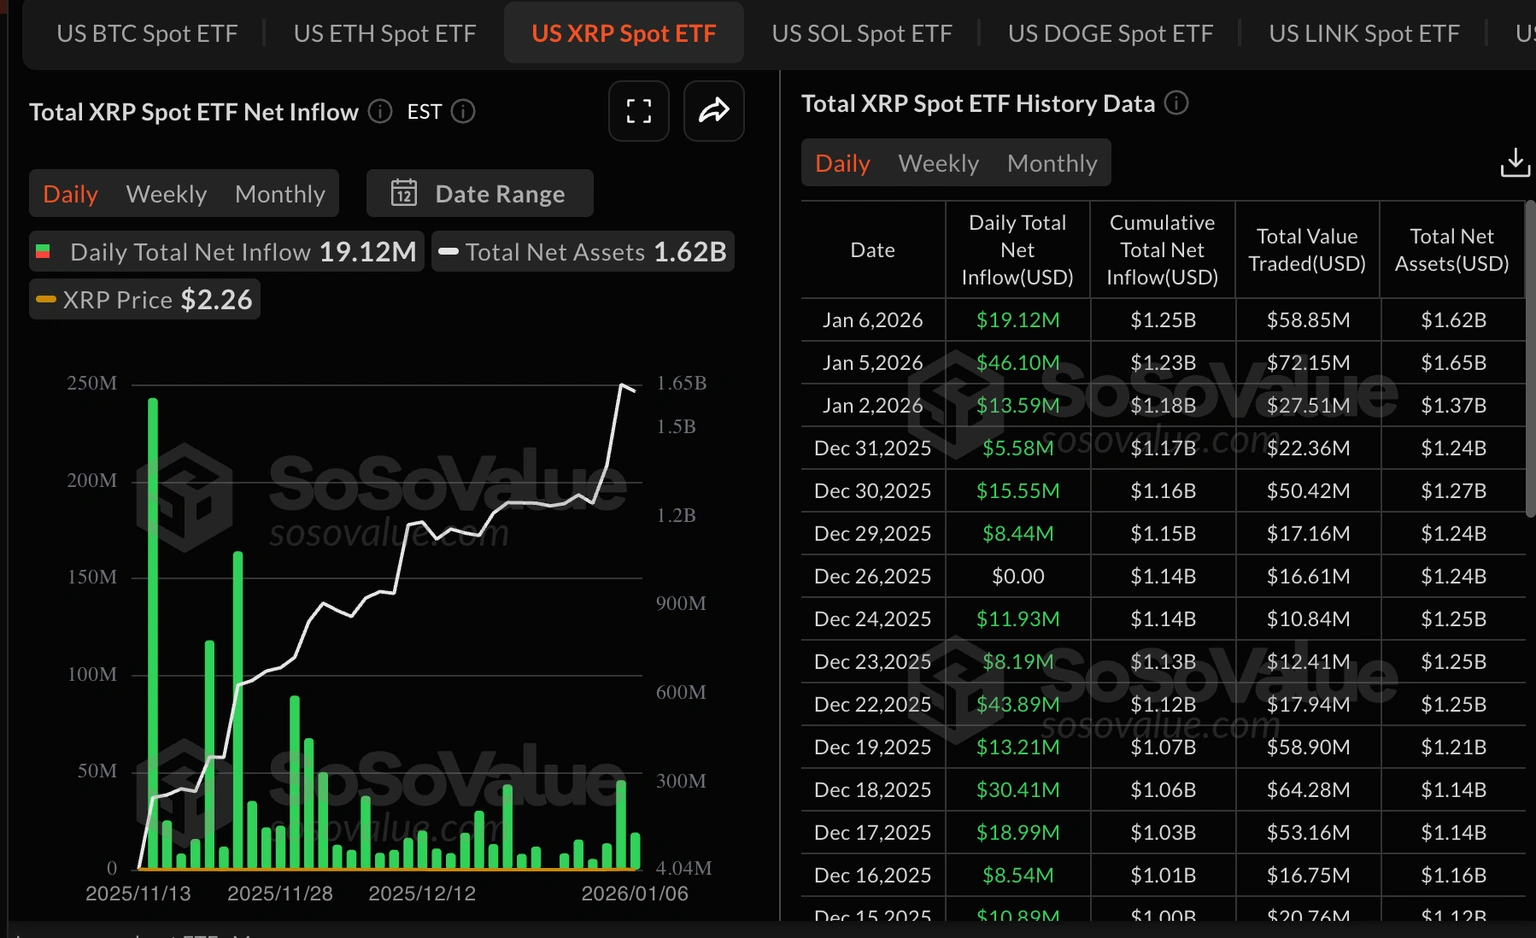
- XRP ETF inflows totaled approximately $19 million on Tuesday, compared to $46 million the previous day.
- The technical outlook indicates building selling pressure, with XRP at risk of further downside to $2.02.
Ripple token (XRP) is trading down at $2.19, as fear circulates throughout the cryptocurrency market. This has reversed the gains made at the beginning of the year, as further downside builds in the market. It seems that profit-taking is taking centre stage, with the belief that XRP will continue its uptrend, hitting a roadblock.
Advertisement

A break above a multi-month downward trendline may move XRP to the target level of $3.00 in the coming weeks. However, with demand weakening below the short-term support at $2.20, XRP is exposed to a prolonged decline.
On the other hand, inflows into XRP ETFs were approximately $19 million on Tuesday, representing a major decline relative to the previous day’s $46 million inflows. Notably, the volume has declined, but interest in US-listed XRP ETFs has remained resilient since their launch in November. It has cumulative inflows of $1.25 billion and an associated net asset of $1.62 billion.
A brief review of the XRP derivatives market indicates a sudden decline in open interest and volume. This warrants caution among traders and investors, as no new capital is entering the market. Futures open interest has decreased by 10% to $4.29 billion over the past 24 hours. Notably, the volume is down 20.61% to $11.36, suggesting reduced market activity. Meanwhile, if the recent decline accelerates, XRP may see further correction toward the $2.02 support level.
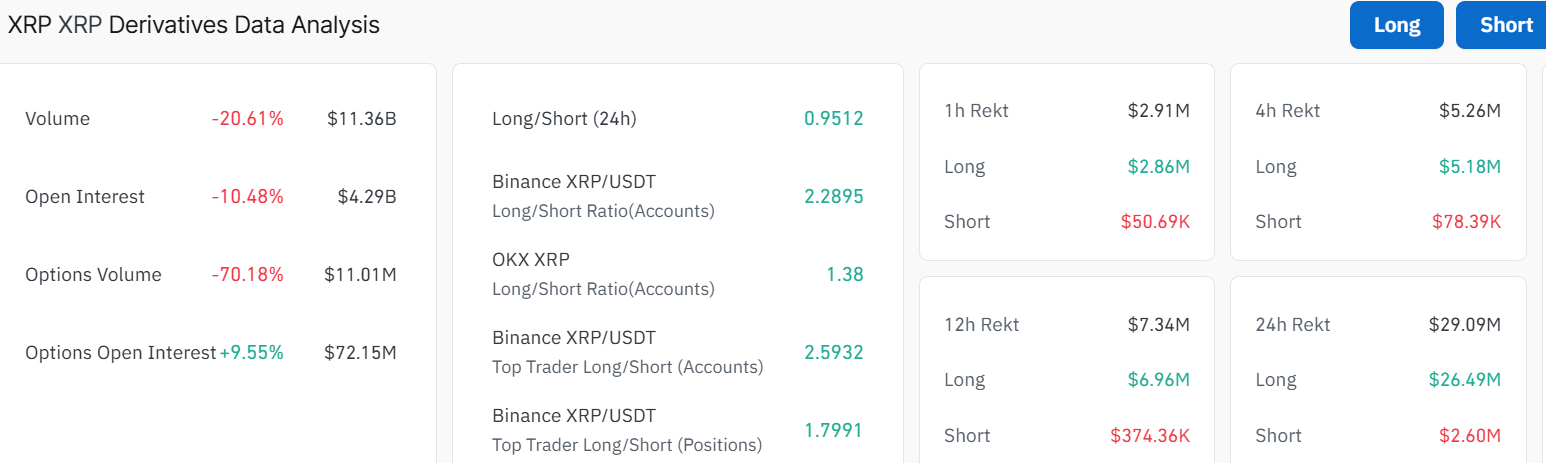
The long-to-short ratio is at 0.95. Its position below 1 cautions of a bearish grip, as more traders are betting on the price to decrease.
XRP Risks Further Downside to $2.02
XRP is in decline following a climb above $2.35. Early profiteering has commenced, leaving the XRP price at approximately $2.19, with further downside potential. The turnaround followed a first-quarter surge that signaled a bullish shift, although it encountered resistance at $2.34.
The momentum indicators are also exhibiting selling pressure. To start with, the Relative Strength Index (RSI) has dropped to 61.25 on the same chart after a short-lived upward swing to overbought levels. This shows waning bullish momentum in the market as the bears attempt to take control. The trend may continue to decline, increasing the likelihood that XRP’s price targets the strong support zone around $2.02, which aligns with the 50-day SMA.
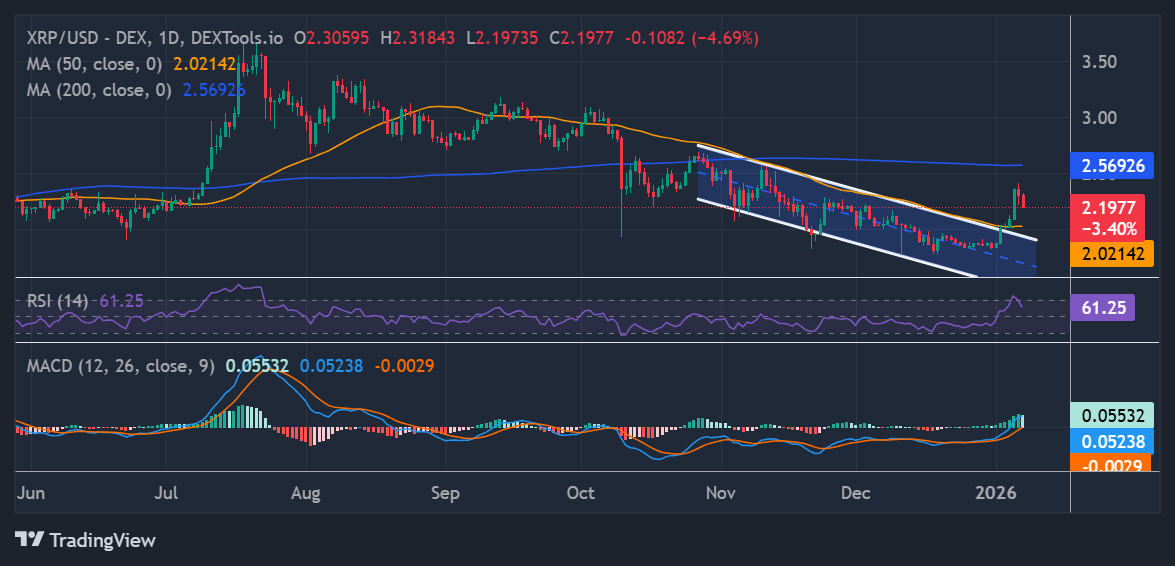
Nonetheless, traders can rely on the Moving Average Convergence Divergence (MACD) indicator, which still indicates positive divergence on the same chart. The buy signal suggests that a larger breakout above the downward-sloping trendline may be imminent.
On the upside, a move above $2.20 may rekindle the bullish hope in XRP. Furthermore, a decisive daily close above the $2.34 resistance will ignite further upside, causing XRP to reclaim the $2.56 immediate resistance level.
![]()
eToro Platform
Best Crypto Exchange
- Over 90 top cryptos to trade
- Regulated by top-tier entities
- User-friendly trading app
- 30+ million users
![]()
eToro is a multi-asset investment platform. The value of your investments may go up or down. Your capital is at risk. Don’t invest unless you’re prepared to lose all the money you invest. This is a high-risk investment, and you should not expect to be protected if something goes wrong.
Advertisement


