XRP Price Forecast – Symmetrical Triangle and Double Bottom Patterns Suggest Rally

Cryptocurrency trading is speculative and your capital is at risk when you trade. We may earn affiliate commissions from some of the products on this page - at no extra cost to you.

Highlights:
- XRP price is gearing up for a breakout, with strong signs pointing toward a push above the $3 mark.
- Whale wallets holding over 1 million XRP just hit record highs, tightening supply and boosting upside potential.
- A double bottom on the 3-day chart hints at a powerful trend reversal taking shape.
XRP has surged to $2.79, representing a 22% gain over the week. Its market capitalization is up to $164 billion, ranking it above Tether as the third-largest cryptocurrency. The 24-hour trading volume stands at $6.84 billion, with an intraday price range of $2.65 to $2.85 in the last 24 hours.
Advertisement

XRP’s current price movement indicates a consolidation period after its aggressive rise. Following the post-rally downside retracement, which was supported at around $2.70, the price has started making higher lows, meaning buyers are again accumulating and mounting energy.
XRP Price Shows Potential for Strong Rally Above $3
XRP’s price has been gradually building a symmetrical triangle pattern, and a breakout may be on the way. As market analyst Ali Martinez suggests, XRP broke out of the upper trend line, sharply trading around the $2.70 price mark. Should XRP take down a weekly close above $3, it would bring about an upward drive.
When you zoom out on $XRP, it's hard not to go all in. A weekly close above $3 could set the stage for a rally to $6 or even higher! pic.twitter.com/h8fROcAC7t
— Ali (@ali_charts) July 12, 2025
In addition, a break above this price could send XRP to targets around $6 or even higher. The chart also indicates important Fibonacci extension zones that could be used as potential resistance zones, such as $6, which is the 1.272 extension, and then $9, which is nearing the 1.414 extension. The overall trend indicates great momentum as long as buyers maintain their pressure.
XRP Price Eyes Breakout as Double Bottom Pattern Unfolds
To build on Ali’s forecast, crypto analyst Steph Is Crypto on X provided a chart showing the formation of a double bottom pattern on the 3-day time frame of XRP. The pattern emerged in mid-April 2025 when the XRP price dropped to $1.65. Following its rejection and failure of resistance at the levels of around $2.60, it again retreated towards the end of May to around $1.90. This formation brought two distinct lows, which normally indicate a trend reversal according to technical analysis.
#XRP DOUBLE BOTTOM BREAKOUT! 👀 pic.twitter.com/DJ3sflq4RT
— STEPH IS CRYPTO (@Steph_iscrypto) July 11, 2025
Since the middle of June, the XRP price has again made an upward movement, finally touching resistance just below the $2.60 mark. The latest candle has finally closed above that area, which is the first definite break of this neckline. Consequently, this indicates that the market may be reversing after months of sideways movement.
Provided the $2.60 maintains as new support, the upside targets are set between $3.40 and $4.00. This trend is seen in a larger timeframe, which enhances the validity of the breakout. The 3-day charts are perceived as more reliable among traders because of the reduced market noise. A further rally beyond this may pave the way to XRP price multi-month highs so long as the bullish trend prevails.
XRP Sees Notable Shift as Whale Accumulation Hits New High
The price of XRP has attracted attention as whale activity closes to its highest level ever. Data from Santiment shows that 2,743 wallets each hold more than 1 million XRP tokens, the highest number of holders ever recorded. Combined, these wallets comprise approximately 47.32 billion XRP, as the number of large investors is becoming concentrated. This trend implies that there is more confidence in the future of XRP.
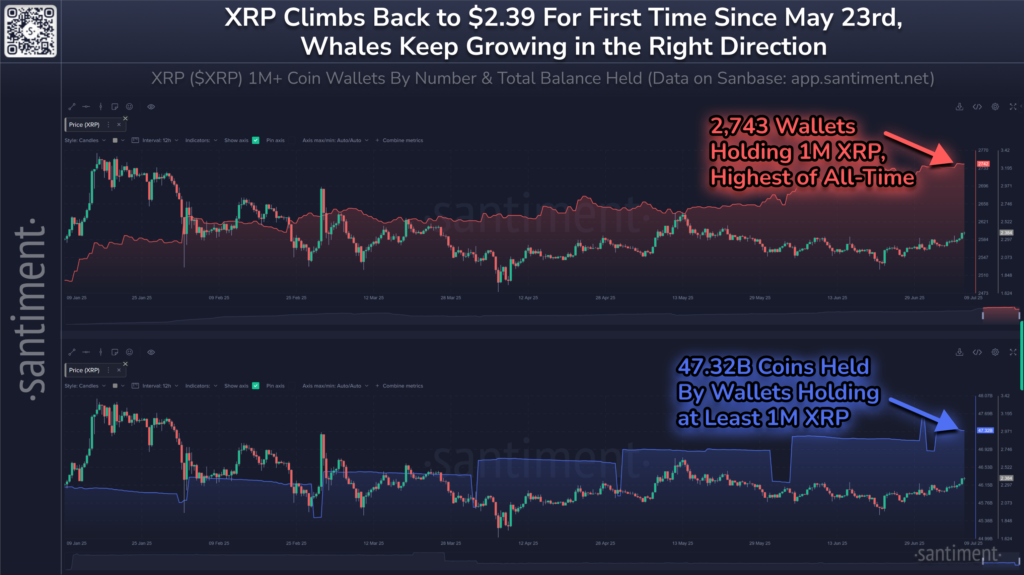
This high concentration has an effect on market liquidity, which lowers the tokens traded in exchanges. It causes an increase in the price volatility, especially because whales currently have more influence on the market. The escalating number of whales can also be an indication of a future bull phase. These investors seem to be priming themselves for the forefront of possible price increases, indicating potential market dynamics in XRP shortly.
Technical Analysis – What’s Next for XRP Price?
XRP is also technically bullish in most of its major timeframes because the increased level of buying pressure is accompanied by aligned stronger momentum indicators such as the Moving Average Convergence Divergence (MACD). Provided that XRP manages to maintain its positions above the current 2.75 level and overcomes the selling pressure at the $3 mark, the $3.20 and higher levels look all the more likely.
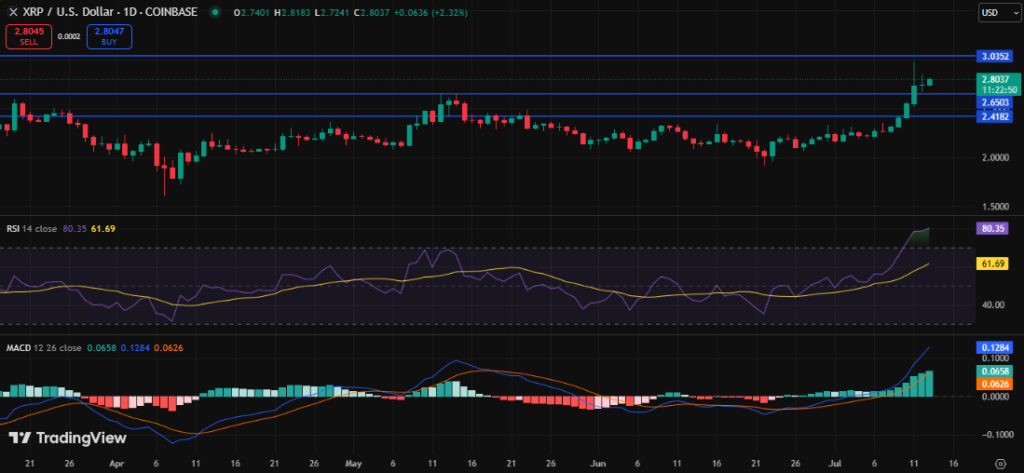
Although there has been a significant rally, oscillators like the Relative Strength Index (RSI) are also in the overbought region. In case volume persists downwards and XRP cannot sustain the support area between the prices of $2.75 and $2.50, then there is a possibility of a larger pullback to the levels of $2.30 or even $1.91
![]()
eToro Platform
Best Crypto Exchange
- Over 90 top cryptos to trade
- Regulated by top-tier entities
- User-friendly trading app
- 30+ million users
![]()
eToro is a multi-asset investment platform. The value of your investments may go up or down. Your capital is at risk. Don’t invest unless you’re prepared to lose all the money you invest. This is a high-risk investment, and you should not expect to be protected if something goes wrong.
Advertisement


