XRP Price Analysis – XRP Steadies at $1.40 Following Steady ETF Inflows

Cryptocurrency trading is speculative and your capital is at risk when you trade. We may earn affiliate commissions from some of the products on this page - at no extra cost to you.

Highlights:
- The XRP price has steadied above $1.40, despite trading below key SMAs.
- The XRP steady inflows into spot ETFs on Monday suggest a potential shift toward risk-on sentiment.
- The technical outlook shows a potential rebound as the TD sequential flashes a buy signal.
Ripple (XRP) is under pressure, and the short-term support is at $1.40, currently exchanging hands at $1.41 on Tuesday. An endeavour to recover earlier in the week sell off to $1.11 to $1.54 stalled on Friday, leaving the market with few price movements between the current support and resistance. On the positive side, the institutional investors are still inclined to risk, and the retail market is showing signs of stability.
Advertisement

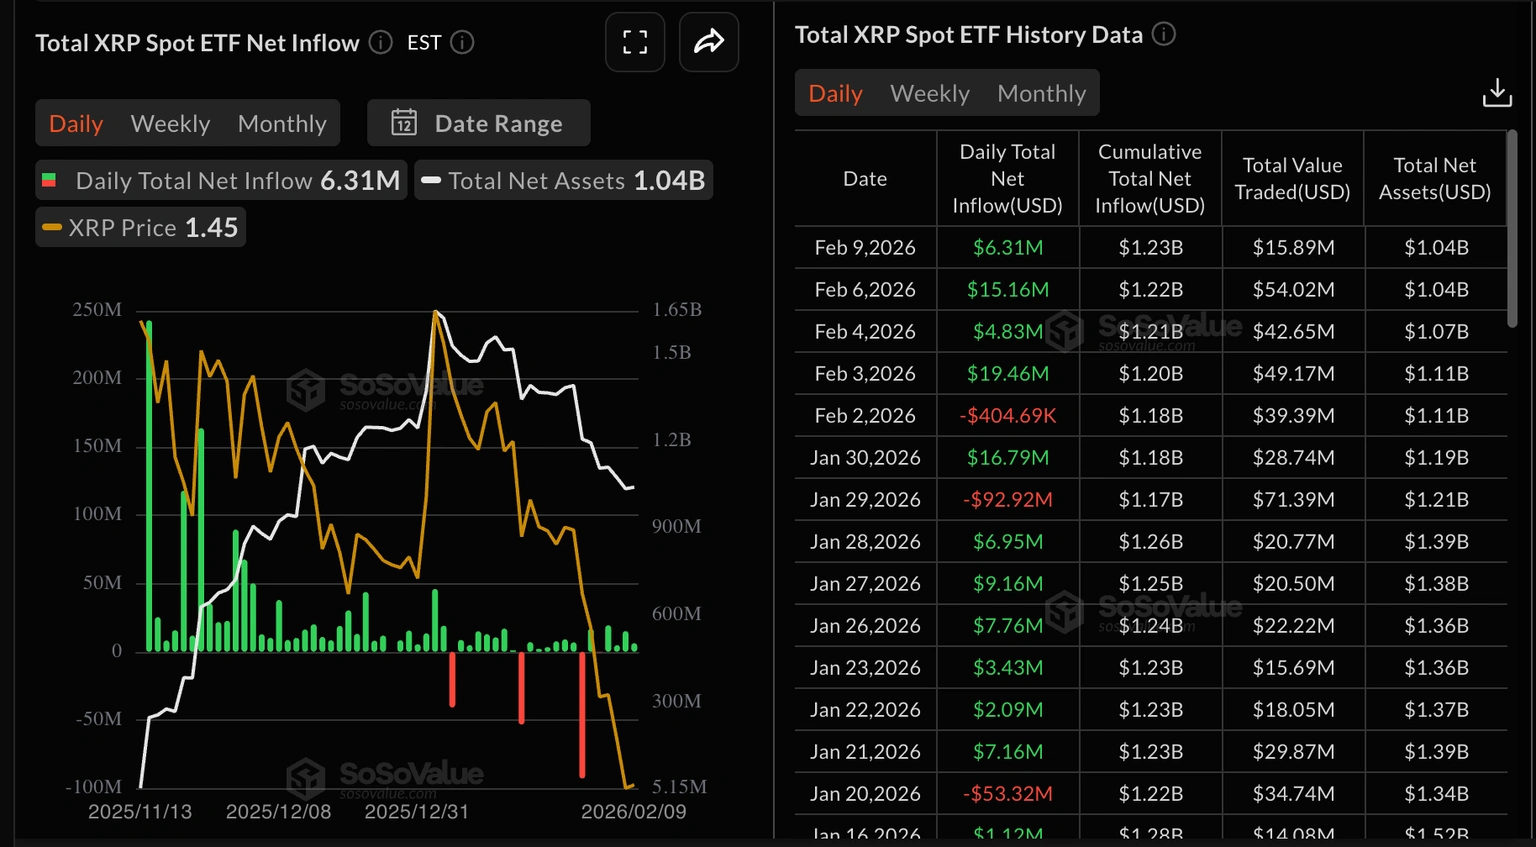
The values in US-listed XRP spot ETFs inflows amounted to $6.31 million on Monday. The total inflows reached $1.23 billion, with the net assets under management being $1.04 billion. The institutional flow on XRP ETFs has been positive with four days of inflows.
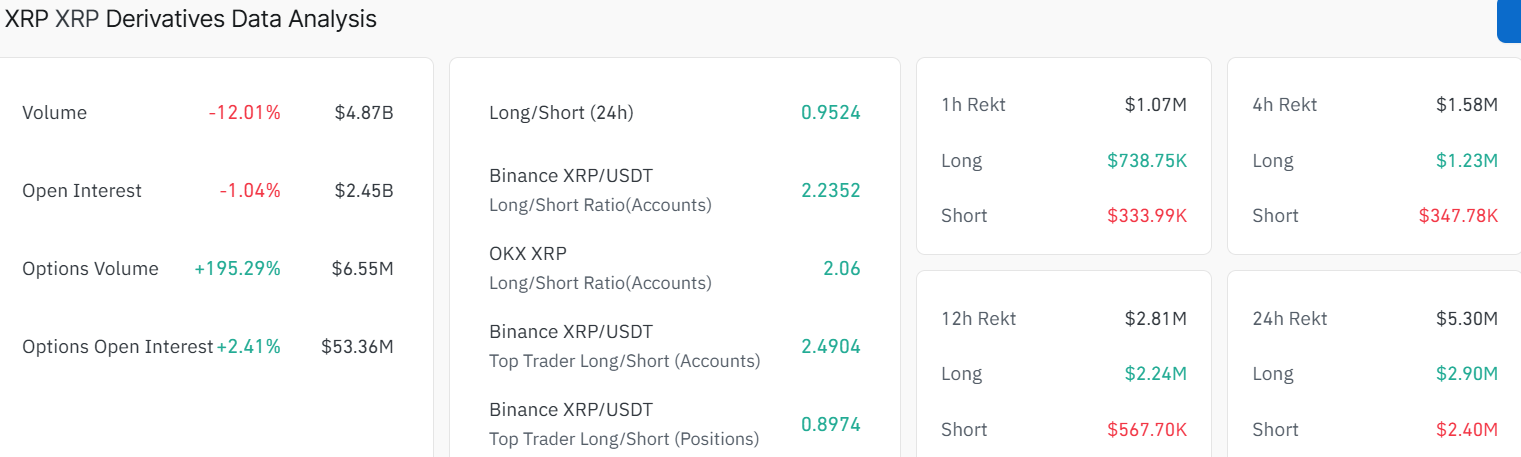
In the meantime, the derivatives market of XRP is poor, characterised by futures Open Interest (OI), which had stabilised at $2.45 billion on Tuesday, marking a 1.04% drop. The stability of the derivatives market indicates that investors are retaining their open positions in the market, and a gradual growth would cast a positive perspective on XRP as investors are moving towards risk-taking.
XRP Price Steadies at $1.40 As the TD Sequential Signals a Buy Signal
On the daily chart, XRP/USD is trading just under the $1.87 mark. Sitting on a horizontal support zone around $1.20-$1.11 that has been tested multiple times in the past few weeks. The 50‑day simple moving average (SMA) is sloping down above the price near $1.87. Notably, the 200‑day SMA is higher, close to $2.42. This outlook shows that the short‑term trend is under pressure, as the XRP price sits within a falling parallel pattern.
As long as XRP holds this support band($1.20-$1.11), bears may find it hard to push the market into a deeper correction. Momentum indicators are, however, showing a bearish outlook, with the Relative Strength Index (RSI) on the daily chart sitting just below the mid‑line near 33.93. This signals that selling has cooled, but buyers have not yet regained control.
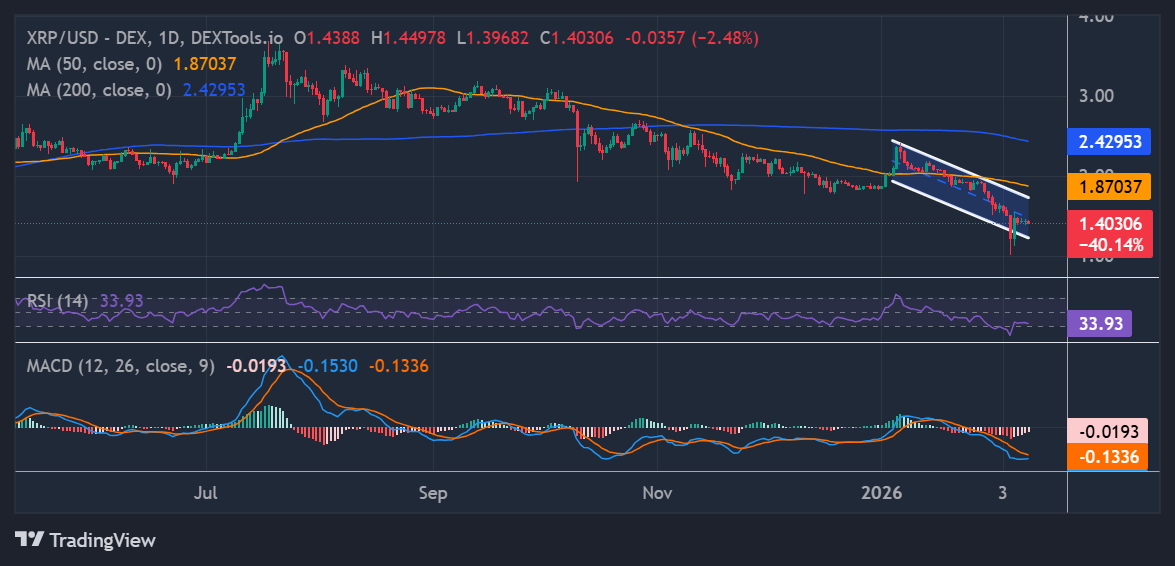
The MACD is curving towards the orange signal line, but is still in the negative territory. This outlook points to a lack of strong direction, unless fresh catalysts appear.
If bulls defend the $1.20 area and the XRP price recovers above the 50‑day SMA around $1.87, the next upside targets sit near $2.00 and then $2.19. A decisive break above this level will open the door to the 200‑day SMA($2.42), which acted as a previous congestion zone. Meanwhile, according to Ali Martinez, a popular crypto analyst, the XRP TD sequential has flashed a buy signal, which may cause a short-term rally.
The TD Sequential perfectly timed the local top on $XRP, and now it’s flashing a buy signal. pic.twitter.com/5FI3Pepsnz
— Ali Charts (@alicharts) February 10, 2026
On the downside, a daily close below $1.20 would weaken the structure and could trigger a slide toward the recent $1.11 lows.
![]()
eToro Platform
Best Crypto Exchange
- Over 90 top cryptos to trade
- Regulated by top-tier entities
- User-friendly trading app
- 30+ million users
![]()
eToro is a multi-asset investment platform. The value of your investments may go up or down. Your capital is at risk. Don’t invest unless you’re prepared to lose all the money you invest. This is a high-risk investment, and you should not expect to be protected if something goes wrong.
Advertisement


