XLM Price Eyes 330% Rally as Bullish Flag Pattern Emerges

Cryptocurrency trading is speculative and your capital is at risk when you trade. We may earn affiliate commissions from some of the products on this page - at no extra cost to you.

Highlights:
- XLM’s price has gained 10% in the last 24 hours, reversing weekly losses.
- Analyst suggest a potential 330% breakout if XLM surpasses key resistance at $0.418.
- Technical indicators, including RSI and MACD, suggest a bullish rally for XLM.
After several weeks of correction, the crypto market is showing signs of recovery as the overall market cap surges by 2% to $2.78 trillion. However, the 24-hour trading volume has declined by 35% to $113 billion, indicating a decreased market activity.
Advertisement

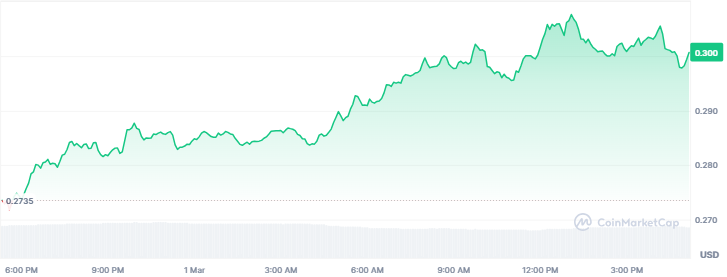
Following the bullish recovery, Stellar has displayed a positive price movement, gaining 10% in the past 24 hours. The bullish momentum has seen XLM erase its weekly decline to 8% while the monthly decrease remains at $25%.
The altcoin has recovered from the lows of $0.25 to retrace the $0.30 mark. At press time, XLM is exchanging hands at $0.300 with a market cap and trading volume of $9.22 billion and $276 billion, respectively.
XLM Price Shows Bullish Flag
Stellar is showing a potential bullish flag pattern, suggesting a strong upward movement. A recent chart analysis from analyst Ali Martinez highlights a descending channel that could lead to a breakout. XLM has been consolidating, forming lower highs and lower lows within this pattern. If the breakout occurs, the price could surge by 330%, aligning with Fibonacci extension levels.
#Stellar $XLM is forming a bullish flag, which could trigger a 330% breakout! pic.twitter.com/hWuQSTkUj0
— Ali (@ali_charts) March 1, 2025
The chart reveals key resistance levels, with $0.41806 acting as a crucial point. A confirmed breakout above this range could drive the price toward $1.08 and beyond. If momentum sustains, XLM could reach $1.8, marking a significant rally in the market.
To further XLM’s breakout, crypto analyst Rose highlights its position at a critical turning point. The price nears a wedge breakout, with confirmation above $0.30-$0.35 signaling a potential rally. If momentum builds, XLM could target $0.64 and extend higher. Key support sits at $0.2077, aligning with the 0.786 Fibonacci retracement.
Stellar ( $XLM) Technical Analysis & Price Prediction 🚀 :
Stellar ( $XLM) is at a critical turning point. A breakout above the wedge structure and confirmation above $0.30-$0.35 could drive price toward $0.64 and beyond. Watch for buying momentum and volume increase as key… pic.twitter.com/73P2xK7Qk5
— Rose Premium Signals 🌹 (@VipRoseTr) February 28, 2025
Additionally, resistance levels at $0.6434 and $0.8466 may define the next price reaction. Increased buying pressure and volume spikes would reinforce a bullish breakout.
Technical Analysis: Will the Bulls Push XLM Price Above Key Resistance Levels?
Technical indicators on the 4-hour chart indicate that XLM price is gearing up for a major upward rally. The bulls have regained the upper hand as green candlesticks continue to form on the chart, reversing the recent downtrend.
Indicators such as Moving Average Convergence Divergence (MACD) and Relative Strength Index (RSI) are trending in the positive territory, indicating a shift in the current market dynamics, which could lead to a fresh price rally in the XLM market.
The RSI, which dropped to the oversold region towards the end of February, has climbed to the neutral region at 54 indexes. This suggests an increase in buying momentum as the selling pressure decreases, which could lead to a hike, possibly breaking above the immediate resistance at the $0.3174 region.
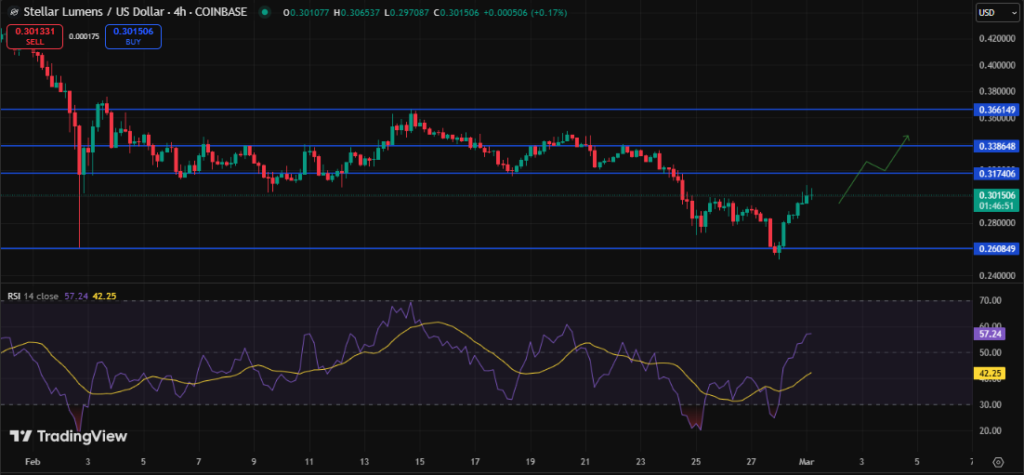
With RSI’s further growth toward the overbought region, a successful break above the $0.3174 region could lead to a break at the next resistance at the $3386 mark. Moreover, the MACD line is still trending further above the signal line, with green bars ruling the histogram supporting XLM’s rally.
The support level at the $0.2600 region has proven strong as the price bounced back swiftly. Should the current trend hold, a break above the key resistance at $0.3660 could be imminent. However, in a scenario where the bears overcome the bulls, XLM could retrace the current support at $0.2600.
![]()
eToro Platform
Best Crypto Exchange
- Over 90 top cryptos to trade
- Regulated by top-tier entities
- User-friendly trading app
- 30+ million users
![]()
eToro is a multi-asset investment platform. The value of your investments may go up or down. Your capital is at risk. Don’t invest unless you’re prepared to lose all the money you invest. This is a high-risk investment, and you should not expect to be protected if something goes wrong.
Advertisement


