Uniswap Price Climbs 2% While Resistance at $7.57 Remains Key for Next Uptrend Move

Cryptocurrency trading is speculative and your capital is at risk when you trade. We may earn affiliate commissions from some of the products on this page - at no extra cost to you.

Highlights:
- The price of Uniswap has spiked 2% to $6.75 with a 29% increase in daily trading volume.
- UNI technical outlook indicates bullish momentum, as bulls eye $7.57 resistance.
- The derivatives market shows a 60% increase in trading activity with strong long positions on Binance and OKX.
The Uniswap price has soared 2% to $6.75, as its daily trading volume has increased 29% in the past 24 hours. The bulls are showing immense strength as the token is up 6% in a week and 26% in the past month. Let’s dive into the technical outlook and see how high UNI can reach in June.
Advertisement

Uniswap Price Technical Outlook Points to Possible Bullish Breakout
The Uniswap price in the daily chart is now flirting around $6.75, slightly below its 200-day moving average of $9.44 but above its 50-day moving average at $5.80. Relative Strength Index (RSI) levels stand at 58.63, reflecting moderate signs of buying. Moreover, there is still more room for the upside before UNI is considered overbought.
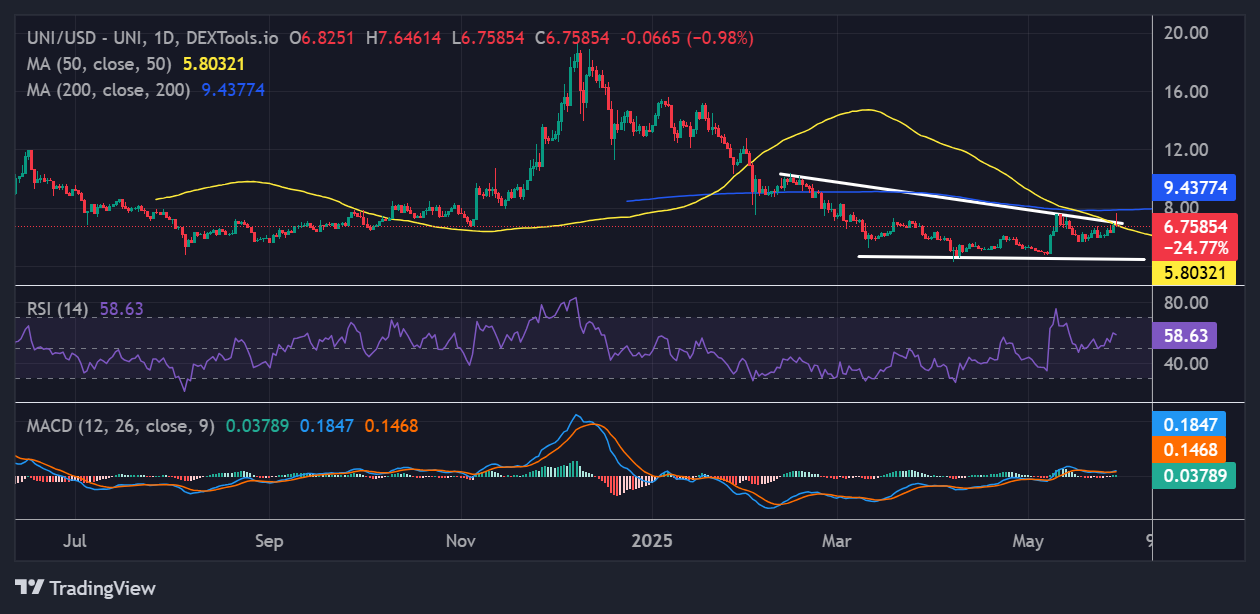
On the other hand, we can see the Moving Average Convergence Divergence (MACD) suggests bullish momentum, as the MACD is crossing over the signal line above. All of this shows that UNI may not be far from a positive breakout towards the upside.
According to Jori, a crypto trader, the Uniswap price appears to be showing signs of an incoming market reversal after watching its prices fall for some time. A recent analysis found that an inverse head and shoulders pattern has formed, usually a sign that a downtrend has ended and the market is starting to improve.
$UNI is forming an inverse head and shoulders.
a classic reversal pattern that usually signals a bottom is in.After months of downward price action, this could finally be the reversal point. A confirmed breakout above the $7.57 level could make the next leg up.
Definitely one… pic.twitter.com/I3tJ7WsUH6
— iori.patron | ガチホ (@ioriNFT) May 29, 2025
A breakthrough above $7.57 on the inverse head and shoulders pattern might see UNI prices climb even further. This structure hints that bullishness could continue and is considered an important place to monitor in the upcoming weeks.
Robust Derivatives Market Reflects Increased Trading Activity
In the derivatives market for UNI, trading activity has risen more than 60% and now stands at around $1.5 billion. The number of UNI derivative traders rose by 3.8% over the past 24 hours. Binance’s long-to-short ratio stands at 2.55, which means a majority of traders are trading long rather than short. The favorable sentiment continues at OKX with a long/short ratio of 2.42.
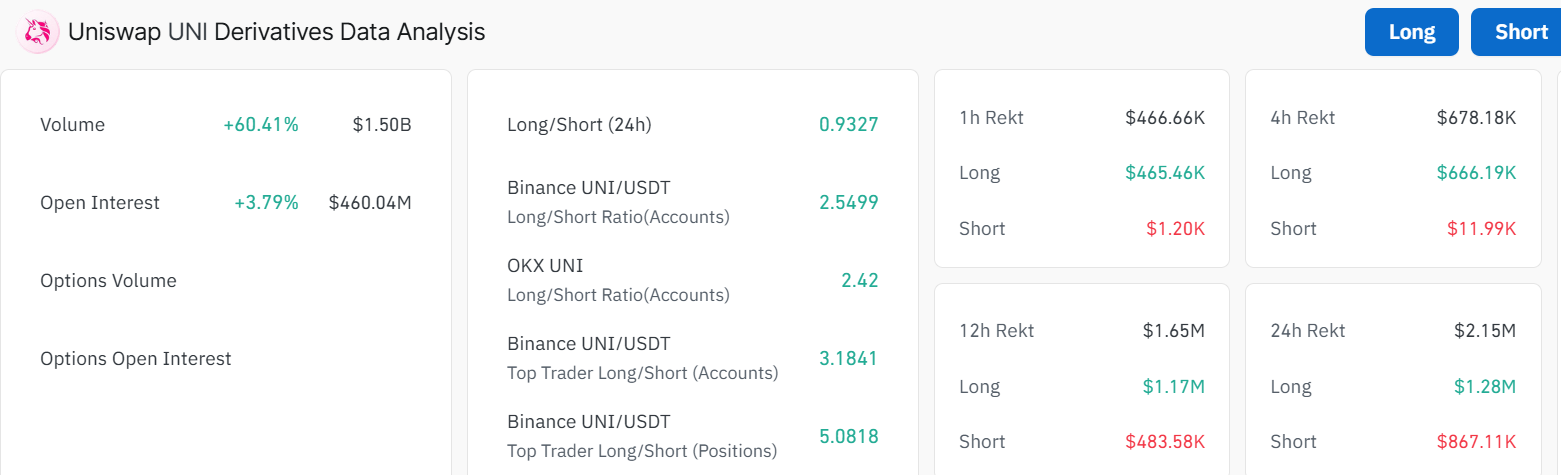
Even so, the data from the past hour and four hours involve over $466K and $678K worth of liquidations, demonstrating that derivatives are unpredictable in the short term.
Market Sentiment and Key Price Levels to Watch
The mood is slightly positive as traders watch for a breakout to happen. At $5.80, the coin has a strong support zone, while a challenge in resistance at $7.57 could lead to a new rise. A move higher than this mark by the bulls could lead to the Uniswap price reaching a $9.43 resistance zone. A breach above this level will cause further upside, validating the bullish trend.
On the flip side, if the $9.43 resistance proves too strong, the Uniswap price could drop. In such a case, the $6.49 support zone will cushion against further downside. A deeper correction will call for deeper support at $6.28, and $5.80.
Still, investors need to pay attention to market changes and watch important indicators. How UNI’s upward trend is corrected could decide its short-term trajectory. With the joining of positive technical indicators, UNI is likely preparing for a rebound. We’ll need to see if the $7.57 level is breached to see if the token will make a lasting upward move.
![]()
eToro Platform
Best Crypto Exchange
- Over 90 top cryptos to trade
- Regulated by top-tier entities
- User-friendly trading app
- 30+ million users
![]()
eToro is a multi-asset investment platform. The value of your investments may go up or down. Your capital is at risk. Don’t invest unless you’re prepared to lose all the money you invest. This is a high-risk investment, and you should not expect to be protected if something goes wrong.
Advertisement


