TRON Price Analysis: Can TRX Hit ATH This October?


Highlights:
- TRON’s token burn drives investor confidence and supply reduction.
- TRON price faces strong resistance at $0.17, testing market bullishness.
- The trading volume surge reflects rising investor optimism and market interest.
TRON (TRX) price has recently surged, signaling a possible shift in its market dynamics. After weeks of horizontal trading, where neither the bulls nor bears could dominate, signs of a bullish momentum are now evident. This comes despite the previously dominant bearish trend, suggesting that TRON may enter a recovery phase as investor optimism grows.
Advertisement

TRON Price Surges After Significant Token Burn
The TRON price has surged as the network destroyed over 10.5 million TRX on October 21st. This action highlights TRON’s dedication to reducing token supply and increasing value. The initiative showcases a strategic move towards deflation by achieving a net negative production ratio of -5,491,165.
#TRON just burned 10,558,556 #TRX on October 21st 🔥 showcasing a commitment to deflation & value growth 🚀 With a net negative production ratio of -5,491,165 🤯 pic.twitter.com/mnLXI0xFq9
— TRON Community (@TronixTrx) October 22, 2024
This recent burn could signal a bullish trend for TRON, reflecting strong community and investor confidence. As the supply decreases, the potential for value increase becomes more apparent, setting a positive outlook for TRX’s market performance.
TRX Price Climbs Amid Recent Market Volatility
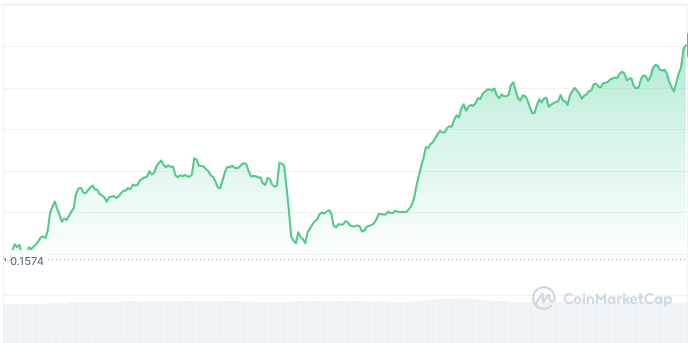
The TRX price has recently seen a noticeable increase, hovering above significant support levels. Over the past 24 hours, the TRX price has risen by 1.48%, achieving a peak of $0.1597. This upward trend reflects growing investor confidence and market dynamics favoring TRON.
The altcoin has recorded a high of $0.1597 and a low of $0.1571, with the cryptocurrency eyeing more gains. TRON currently holds a market cap of $13.82 billion, reflecting an increase of 1.56%. In the past 24 hours, the trading volume reached $315.82 million, showing a rise of 5.97%.
The crypto market declined today, with Bitcoin (BTC) slipping to the $66K range over the past 24 hours. Major altcoins like Ethereum (ETH), Solana (SOL), and XRP followed suit, reflecting a broader downward trend in the market.
Simultaneously, the global cryptocurrency market cap dropped by 1.02%, reaching $2.31 trillion. This sudden decrease has raised concerns among investors, signaling potential volatility in the crypto space.
The TRON price faces a crucial test as it hovers near the $0.17 resistance level, which has proven to be a tough barrier. Breaking through this mark could trigger further upward momentum, with the potential for the price to climb to $0.20. A successful rally beyond that could eventually lead to TRON reaching $0.3004, a significant target as it would bring the price closer to its all-time high (ATH) recorded on January 5, 2018.
Can TRX Price Hit ATH Soon?
On the downside, TRON could experience a price pullback if market sentiment shifts negatively. A drop below the $0.17 level could see the asset retreat to $0.15, a key support level.
If selling pressure intensifies and investor pessimism grows, TRX may fall further to $0.13. In a worst-case scenario, the price could even slide to $0.10, signaling a deepening bearish trend and a potential long-term downturn for the cryptocurrency.
The daily technical indicators for TRX suggest a potential bullish momentum as it approaches a key resistance level. The Relative Strength Index (RSI) is in a neutral zone, with a value of 57.82, suggesting the market is not overbought or oversold.
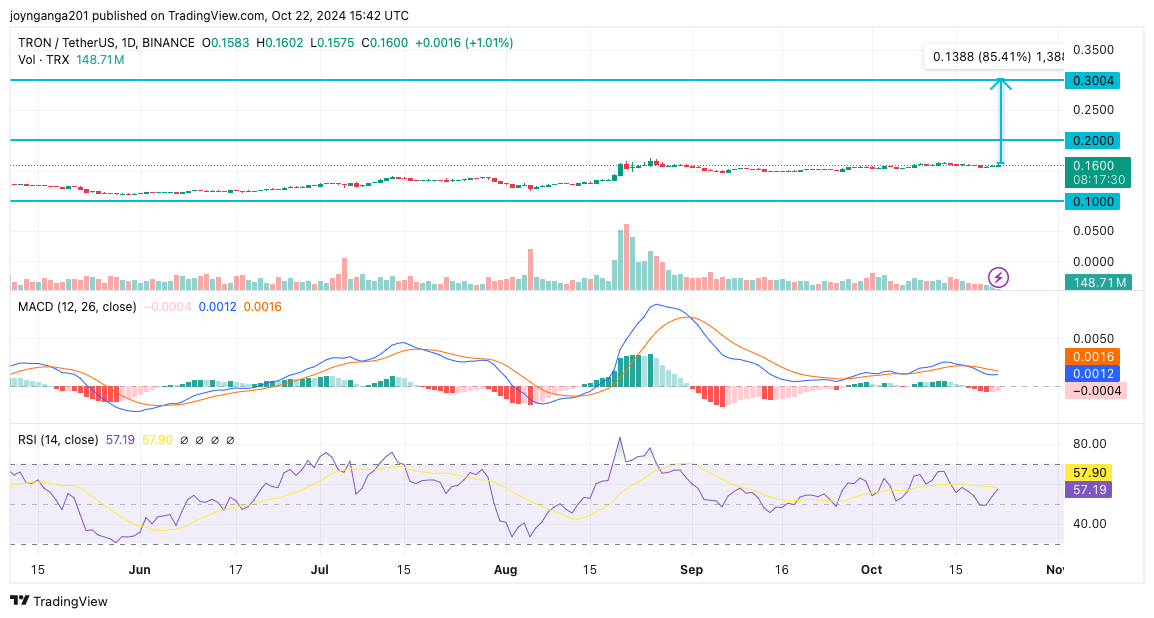
The Moving Average Convergence Divergence (MACD) chart indicates a gradual upward movement. The MACD line (blue) has crossed above the signal line (orange), a bullish sign that points to a possible continuation of the positive trend.
Advertisement


Joy Nganga
Joy is a Market Analyst and Blockchain Technology Writer at Crypto2Community. With over five years of experience, she is highly skilled in the crypto market and well-versed in blockchain technology. AnnJoy offers the latest news and insightful analysis, making her a valuable resource for informed decisions in the crypto space.
View full profile ›ℹ️About Crypto2Community's Editorial Process
Crypto2Community's editorial policy is centered on delivering thoroughly researched, accurate, and unbiased content. We uphold strict editorial policy and sourcing standards, and each page undergoes diligent review by our team of top crypto industry experts and seasoned editors. This process ensures the integrity, relevance, and value of our content for our readers.