Toncoin Price Jumps 1.6% as Stablecoin Growth and Market Demand Surge

Cryptocurrency trading is speculative and your capital is at risk when you trade. We may earn affiliate commissions from some of the products on this page - at no extra cost to you.

Highlight
- Toncoin’s price rose 1.6% to $4.84, with trading volume increasing 24% to $276 million.
- Toncoin’s USDT stablecoin surged 670% in six months, topping $1 billion due to rising demand and lower fees.
- The TON/USD pair is forming a double-bottom pattern at the $4.8 support level, suggesting a bullish reversal.
The Toncoin price has surged 1.6% in the last 24 hours to trade at $4.84 as of 4 a.m. EST on a 24% pump in trading volume to $276 million. the market capitalization now stands at $12.3 billion.
Advertisement

Toncoin’s (TON) USDT stablecoin has surged past $1 billion with a 670% increase over the past six months, making it the 10th largest network in stablecoin dominance. This growth is attributed to the overall rise in stablecoins and Toncoin’s competitive transaction fees, which fell 42% from $0.061 to $0.035.
670% Increase in 6 Months: USDT on the TON Network Surpasses $1 Billion!
“In May 2024, the $TON blockchain held only $130 million worth of USDT, but over six months, this amount surged by 670% to reach $1.02 billion.” – By @burak_kesmeci
Link 👇https://t.co/inwMcs3Tq4 pic.twitter.com/UnOk3QNFAI
— CryptoQuant.com (@cryptoquant_com) November 2, 2024
However, after an 80% rally from May to June, Toncoin’s price declined in August due to external pressures. Current market sentiment is moderately bullish, with 53% of Binance traders holding net long positions, but increased sell-side pressure indicates that further interest is needed for sustained price improvement.
Analyst Burak Kesmeci projects that “USDT supply is expected to expand to $200 billion (from current $120B) during the bull rally. This growth will likely drive further demand for fast and low-cost blockchain networks like TON, leading to continued growth in the amount of USDT on the TON network.” This anticipated growth underscores the importance of monitoring key resistance levels and market dynamics.
Toncoin Statistics
- Ton price: $4.84
- Market capitalization: $12.3 billion
- Trading volume: $276 million
- circulating supply: 2.5 billion
- Total supply: 5 billion
Toncoin Price Analysis Shows Potential for Bullish Reversal
The TON/USD trading pair, based on a 4-hour chart from DEXTools, reveals several important technical indicators and patterns. The price of Toncoin is approximately $4.8259, with a significant support zone forming a double-bottom pattern around the $4.8 level.
This pattern is often indicative of a bullish reversal, suggesting a potential price rebound. Recently, the price has tested this support level, and a bounce from here could signal the beginning of a bullish rally.
The 50-period Moving Average (MA), represented by the blue line, is currently around $4.93. The price is trading slightly below this SMA, which typically suggests a bearish trend in the short term. Similarly, the 200-period Moving Average, indicated by the green line, is positioned at $5.14.
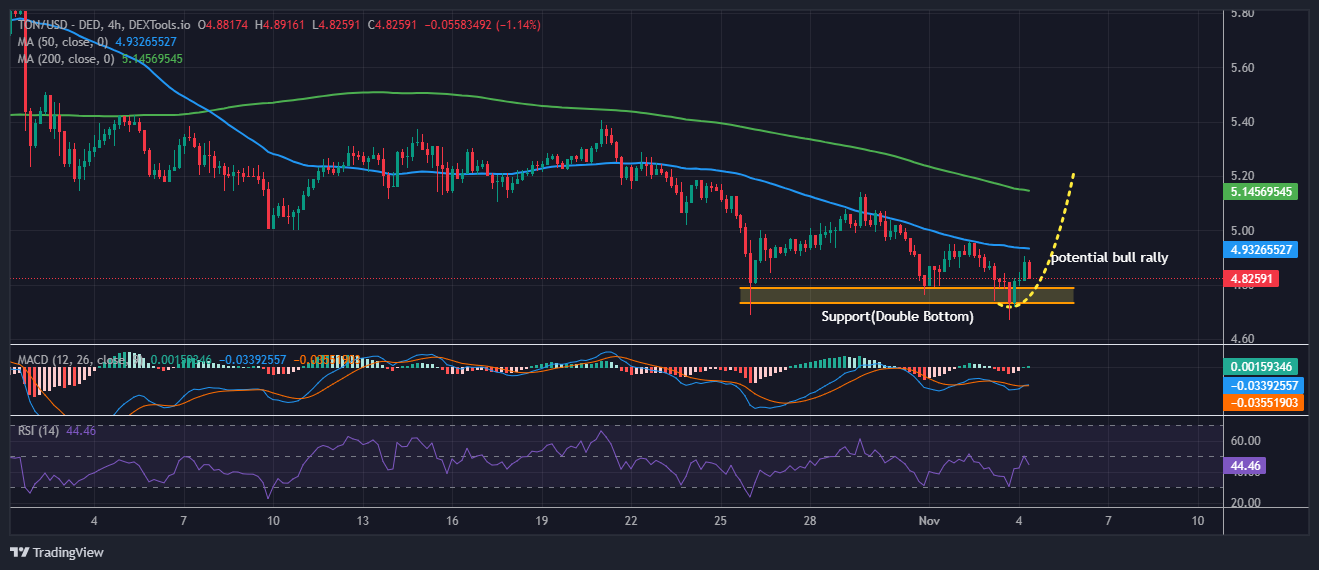
With the price below this line, the overall trend remains bearish; however, a move back above this level would enhance bullish momentum. The chart also shows a dotted line suggesting a potential bullish rally if the price successfully bounces off the support zone. For this rally to materialize, the price would need to break above the 50-period MA at $4.93 and, ideally, the 200-period MA at $5.14.
Bullish Technicals Signal Further Uptrend
The MACD (Moving Average Convergence Divergence) line is close to the signal line and accompanied by a slightly positive histogram. This configuration indicates a possible trend reversal or at least reduced selling pressure, with a bullish crossover, where the MACD line crosses above the signal line, strengthening the likelihood of a rally for the Toncoin price.
Meanwhile, the RSI (Relative Strength Index) is currently at 44.46, which is below the 50 level. This indicates that the asset is still in a bearish or neutral zone. An increase in the RSI above 50 would suggest strengthening buying momentum, further supporting the potential rally.
Toncoin price indicates that the pair is at a critical support level, presenting a potential for a bullish reversal. Key price levels to monitor include $4.8 (support level), where a break below could invalidate the double-bottom pattern and lead to further downside. However, a break above the 50-period SMA and 200-period SMA could pave the way for higher price levels. It’s essential to keep an eye on the MACD and RSI for confirmation of any trend changes.
Advertisement


