Sui Price Holds At $0.804 Support Level, How High Can SUI Reach?


The SUI price has slipped by 4% today, with the SUI/USD trading at $0.857. Its 24-hour trading volume has notably plunged 2% to $280 million, indicating a decrease in market activity. Despite the recent plunge, SUI prices are up 3% in a week, 3% in a month, and a whopping 54% in a year. This underlines its credentials as one of the fastest-growing tokens in the crypto market. Meanwhile, rewards from the Sui Bridge incentive program are now available for participants to claim.
🚀 184k transactions down, countless improvements made!
Advertisement
🌉 The #Sui Bridge incentive program is a wrap, and rewards are ready to be claimed! 🛄
🙌 Kudos to everyone who joined us to stress-tested this vital infrastructure—your efforts are pushing #Sui Bridge closer to Mainnet!… https://t.co/h6mVIcQHUg
— SuiPad 🌊 – Launchpad on Sui (@SuiPadxyz) August 16, 2024

Since its kick-off in June, over 184k transactions have been completed. Throughout the program, the Sui team concentrated on five crucial areas: functionality, stress, security, usability, and governance. These focus points were essential in refining the bridge’s performance and ensuring it could handle the demands of a fully operational network.
Sui Statistical Data
Based on CoinmarketCap data:
- SUI price now – $0.857
- SUI market cap – $2.25 billion
- SUI total supply – 10 billion
- SUI circulating supply – 2.59 billion
- SUI ranking – #32
Will the Bulls Capitalize On the Golden Cross At $0.815 to Propel the Price?
The Sui price is set for an upward movement as it has reclaimed its support at $0.804. Moreover, the two moving averages (50-day and 200-day) have formed a golden cross, which may enable the bulls to propel the price. A golden cross suggests that the short-term Moving Average(MA) rises above the long-term MA. Most traders and investors interpret this occurrence as a strong bull market.
The token has flipped the 200-day Simple Moving Average into support at $0.804. However, the $0.896 resistance level, which coincides with the 50-day SMA, must be weakened before the bulls initiate a rally.
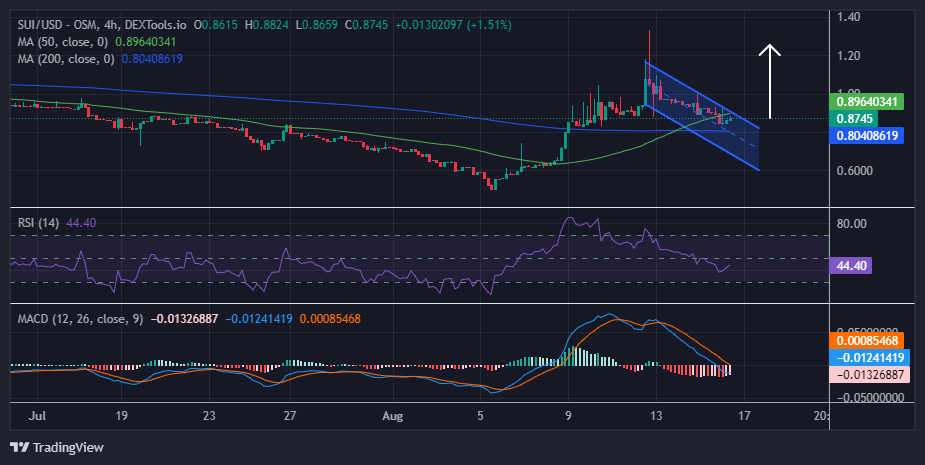
Moreover, the Relative Strength Index is hovering below the 50-mean threshold. Currently, at 44, increased buying pressure could see the RSI jump to the 70-overbought zone. Moreover, its position below 70 indicates significant upside potential before SUI is considered overbought. However, traders looking to take long positions on the token should consider waiting for the SUI price to break and close above $0.896.
On the other hand, the Moving Average Convergence Divergence (MACD) displays some bearish prospects in the market. The MACD indicator has crossed below the signal line in orange, tilting the odds towards the sellers. However, the momentum indicator teases with a buy signal, which will be manifested if the MACD crosses above the signal line. In such a case, traders and investors are inclined to buy SUI.
Will the Bulls Weak the $0.89 Resistance Key?
The 4-hour chart analysis above shows that the bulls are getting ready to enter the market. Despite the bearish prospects, the golden cross formed around $0.815 on August 14 may enable the bulls to initiate a rally. But first, they must deal with the $0.89 technical barrier.
If the bulls flip the $0.89 into the support floor, the SUI price could surge to $1.18. The price could record a new ATH at around $2 in a highly bullish scenario. Conversely, if the bears capitalize on the MACD indicators, which suggests a sell signal, the SUI price could drop. In such a case, a breach and break below the $0.804 support level would see the price plunge to around $0.715.
Advertisement


Emmaculate Araka
Emmaculate Araka is a cryptocurrency writer with published works on Crypto2Community and other news sources. She is believer in the transformative power of crypto and the blockchain industry, conducting on-chain analysis, breaking down market-triggering events, and helping traders and investors benefit from expert technical price analysis. Emmaculate finds gratification in diving deep into the crypto space, earning herself significant knowledge and experience. She holds a Bsc. in Information Science, and outside work, Emmaculate loves reading novels and watching documentaries.
View full profile ›ℹ️About Crypto2Community's Editorial Process
Crypto2Community's editorial policy is centered on delivering thoroughly researched, accurate, and unbiased content. We uphold strict editorial policy and sourcing standards, and each page undergoes diligent review by our team of top crypto industry experts and seasoned editors. This process ensures the integrity, relevance, and value of our content for our readers.