Solana Price Surges Amid Growing Concerns Over Potential Kamala Harris Win in U.S. Election


The Solana price has surged 2.7% in the last 24 hours to trade at $146 as of 5:07 a.m. EST, on a 16% increase in trading volume to $2.9 billion. The market cap is now at $68 billion. This new bullish outlook comes after two weeks of high volatility driven by tempered expectations in the macroeconomic and regulatory environments.
Solana’s price shows signs of a bullish trend, with short-term support holding firm at $140. The recent rise above $145 reflects growing interest among traders, with many now eyeing the $200 target. However, there’s a noticeable concern within the crypto community about what could happen if Kamala Harris wins the U.S. presidential election later this year. While Donald Trump, the Republican candidate, is seen as the crypto-friendly option, his chances have slipped since President Joe Biden dropped out of the race.
Advertisement

Ok @MatthewFoldi you're reporting that Kamala Harris is likely to nominate Gary Gensler as Treasury Secretary if she wins.
How reliable are your sources here?
Because if true this would basically END crypto in the U.S. and we might as well flee the country now. pic.twitter.com/tsTjw2IdNh
— RYAN SΞAN ADAMS – rsa.eth 🦄 (@RyanSAdams) August 19, 2024
Currently, the odds are in Harris’s favor, raising worries because she might continue with the Biden Administration’s policies. According to Sentiment Insights, there’s speculation that she could app the strength of the bulls, which aim to ensure Secretary.
Gensler’s strict approach to cryptocurrency regulation has been a point of contention, and his potential move to the Treasury could spell trouble for the broader crypto industry, particularly for assets like Solana (SOL) and Cardano (ADA), especially with the SEC already questioning Solana’s security status.
Solana Price Statistics
- Solana price: $146
- Market cap: $68 billion
- Trading volume: $2.9billion
- Circulating supply: 466 million
- Total supply: 582 million
Bulls Gear Up for a Breakout Above the Bullish Pennant
The SOL/USDT pair on the daily timeframe indicates several key technical patterns and levels that suggest potential future price movements. The most prominent feature is a bullish pennant formation, generally seen as a continuation pattern following a solid upward trend. This pattern developed after a significant rise in price earlier in the year when the market entered a consolidation phase marked by narrowing price action within a pennant-shaped boundary.
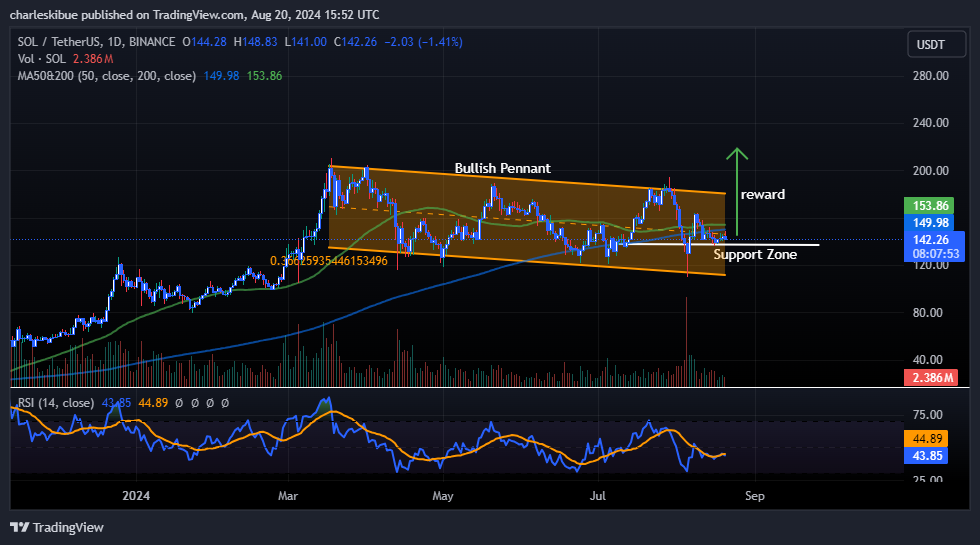
Currently, the price sits within a critical support zone, where the market has previously found buying interest. This area is essential to watch, as holding above this zone could lead to a bullish breakout, potentially driving the price higher. The chart also shows resistance around $242, marked by a double top formation from earlier in the year, which could serve as a significant barrier if the price rises.
The moving averages (50-day and 200-day) converge, with the price slightly below both, indicating a possible area of resistance ahead. The Relative Strength Index (RSI) is currently at 44.88, suggesting that the market is in neutral territory but closer to being oversold than overbought. This positioning could imply room for upward momentum of the Solana price if buyers step in.
Solana Price Poised for a Further Uptrend
There is a potential for an upward breakout if the price holds above the current support zone and successfully breaks out of the bullish pennant pattern. If this breakout occurs, the price target for the next significant resistance level will be around $200 in the short to medium term.
However, if the price fails to hold the support zone and breaks downwards, there could be a retest of lower levels, possibly towards $120. The RSI’s current position suggests that while the market has yet to reach the oversold zone, there is room for further decline if bearish momentum increases.
Advertisement


Charles Kibue
Charles Kibue is a cryptocurrency researcher and writer with published works on Crypto2Community and a range of other sites. He has also worked as a technical writer, researching NFTs and crypto projects. Charles is an English Literature graduate residing in Kenya. He possesses additional expertise in market analysis and offers accurate and reliable insights, staying up-to-date with the latest developments in the crypto industry. Beyond his professional pursuits, Charles enjoys hiking and horse riding in his leisure time.
View full profile ›ℹ️About Crypto2Community's Editorial Process
Crypto2Community's editorial policy is centered on delivering thoroughly researched, accurate, and unbiased content. We uphold strict editorial policy and sourcing standards, and each page undergoes diligent review by our team of top crypto industry experts and seasoned editors. This process ensures the integrity, relevance, and value of our content for our readers.


