Solana Price Slips 6% in a Week as SOL Stalls Below $130, What’s Next for the Alt?


The Solana price has been on a downtrend over the past few weeks as the bulls struggle to gain stamina in the market. The SOL price has plunged 3%, with the altcoin trading at $129 in the past 24 hours. The altcoin is now down by 6% in a week and 13% in a month, yet it holds on to a 562% gain in the past year.
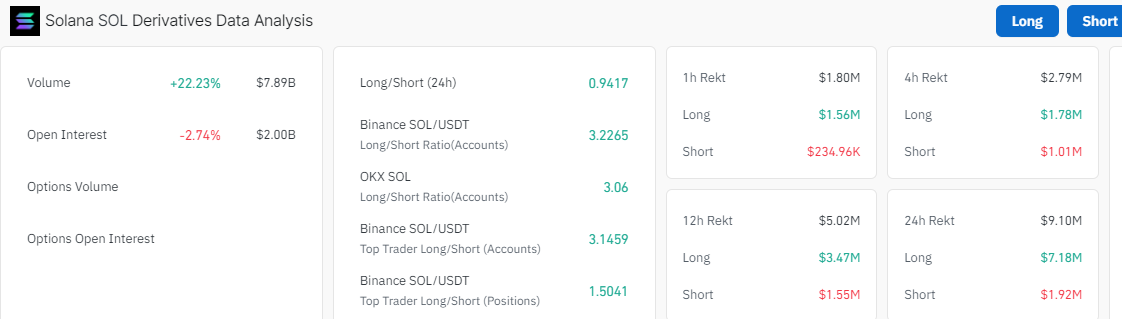
The SOL price is currently stuck between $134 and $127 tight range, which may act as an accumulation period before the next leg up. However, this won’t take long, as data signals investors may be preparing for a potential move soon. A 2.74% slump in Open Interest (IO) to $2 billion may seem small, but the volume has surged 22% to $7 billion. This suggests a potential shift in sentiment in the direction of Solana’s price.
Advertisement

Solana Statistical Data
Based on CoinmarketCap data:
- SOL price now – $129
- SOL trading volume – $2.3 billion
- SOL market cap – $60.94 billion
- SOL total supply – 583 million
- SOL circulating supply – 466 million
- SOL ranking – #5
SOL Falls Like a Dead Weight in the Air, Will the Bulls Gain Momentum?
The SOL price token has fallen like a dead weight in the air with no strong guards to keep the bearish sentiments in check. However, the bulls gathered some stamina at around the $127 support level, regaining composure to prevent further downward losses.
This has led to the Solana price trading within the confines of a falling channel, as the seller’s take control of the market. Over the past few days, the SOL price has been stuck in a tight range, with the upper limit/resistance at $134 and the lower limit/support at $126. This moving period between horizontal support and resistance levels may act as an accumulation period before the bulls initiate a strong move upward.
Solana Technical Outlook
Based on the technical information, there is a mixed reaction in the Solana market, however, a break on either side, will determine the direction of SOL. To start with, the Solana price trades below the 50-day and 200-day Simple Moving Averages (SMAs), upholding a bearish sentiment in the market. However, all hope is not lost in Solana as the bulls only need to conquer the $133 and $143 resistance barriers, to invalidate the bearish outlook.
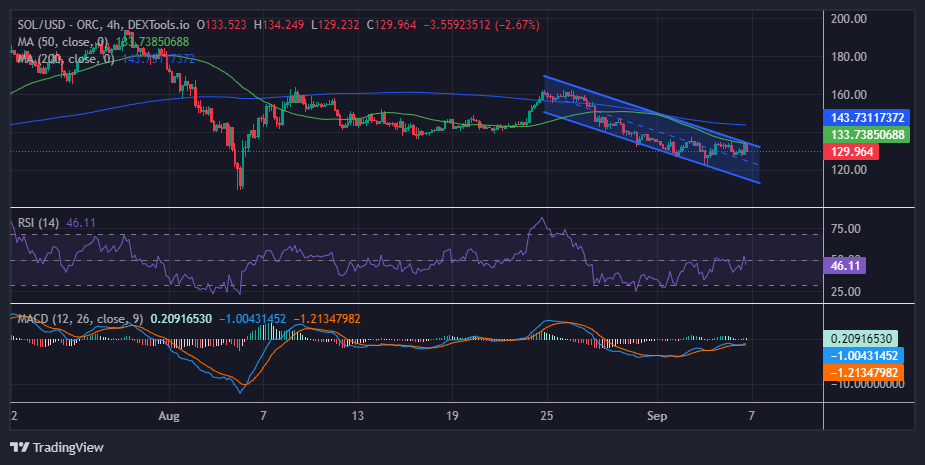
On the other hand, the Relative Strength Index (RSI) is hovering below the 50-mean level, bolstering the bearish sentiment. However, if the bulls begin to add to their positions at this level, the RSI could hurtle above the 50-mean level, potentially to the 70-overbought zone.
Nonetheless, the Moving Average Convergence Divergence (MACD) indicator upholds a bullish outlook. This suggests that traders are at liberty to hold their long positions in SOL intact, bolstered by the bullish outlook. A buy signal has validated the rally with the blue MACD line stepping above the orange signal line. The momentum indicator has also been trending upwards into the positive region, hurtling towards the mean line at 0.00.
Solana Price Prediction
In the 4-hour chart above, there is a mixed reaction in the SOL market. However, if the significant support level at $127, with a key support zone around $126 breaks, SOL could drop. A break below this could drive Solana toward the $122 level. On the upside, Solana’s price needs to break above the descending channel and the resistance at $143 to shift the tone in the market to bullish.
Advertisement


Emmaculate Araka
Emmaculate Araka is a cryptocurrency writer with published works on Crypto2Community and other news sources. She is believer in the transformative power of crypto and the blockchain industry, conducting on-chain analysis, breaking down market-triggering events, and helping traders and investors benefit from expert technical price analysis. Emmaculate finds gratification in diving deep into the crypto space, earning herself significant knowledge and experience. She holds a Bsc. in Information Science, and outside work, Emmaculate loves reading novels and watching documentaries.
View full profile ›ℹ️About Crypto2Community's Editorial Process
Crypto2Community's editorial policy is centered on delivering thoroughly researched, accurate, and unbiased content. We uphold strict editorial policy and sourcing standards, and each page undergoes diligent review by our team of top crypto industry experts and seasoned editors. This process ensures the integrity, relevance, and value of our content for our readers.