


The Solana price is winning on the charts today, with the SOL token surging 1% to trade at $156, painting the SOL market bullish. This upward momentum is supported by a notable increase in trading volumes, which have risen 34% to $2.78 billion.
This comes as the broader crypto market paints a bullish picture, starting with the leading cryptocurrency, Bitcoin, which is up 1.4% at the time of writing. Bitcoin’s price has a ripple effect on cryptocurrencies, as most tokens ride on the wave of the King of Cryptos.
Advertisement

Moreover, according to Bulloro, a crypto trader, Solana has run almost 7% profit, committing the coin to even higher gains.
#SOL 7% profit in Spot and 140% in future with 20X 🚀 pic.twitter.com/RRGbRNc7o0
— BULLORO – Trading Signals (@bulloro_trading) July 16, 2024
On the other hand, Solana awaits approval of the recently filed Solana ETF by VanEck. Various crypto investors and traders are optimistic about the price outlook, speculating that the approval will send the token to the moon. A well-known crypto analyst, Lark Davis, mentioned via the X platform that Solana’s value might grow greatly once a spot Solana ETF is approved.
Solana To 9X If ETF Approved! pic.twitter.com/MiL01fFtzg
— Lark Davis (@TheCryptoLark) July 13, 2024
Solana Price Statistical Data
Based on Coinmarketcap data:
- SOL price now – $156
- SOL market cap – $72 billion
- SOL total supply – 590 million
- SOL circulating supply – 464 million
- SOL ranking – #5
The SOL price trades with a bullish bias within a rising channel. The Solana bulls capitalized on the golden cross made at around the $140 mark, skyrocketing the price upward. A golden cross is an index on the chart when a short-term moving average flips above a long-term moving average. This oftenly assures market participants that the path with the least resistance is to the upside.
Technical Indicators Point To Further Gains In The SOL Market
Although the bulls have faced a slight retracement at around $158, the odds still tilt towards the buyers, as technical indicators suggest a bullish picture.
To start with, the SOL price trades well above both the 50-day Simple Moving Average (SMA) in (green) and the 200-day Simple Moving Average in (blue). In this scenario, the $140 and $143 act as immediate support levels, suggesting intense bullish sentiment in the market.
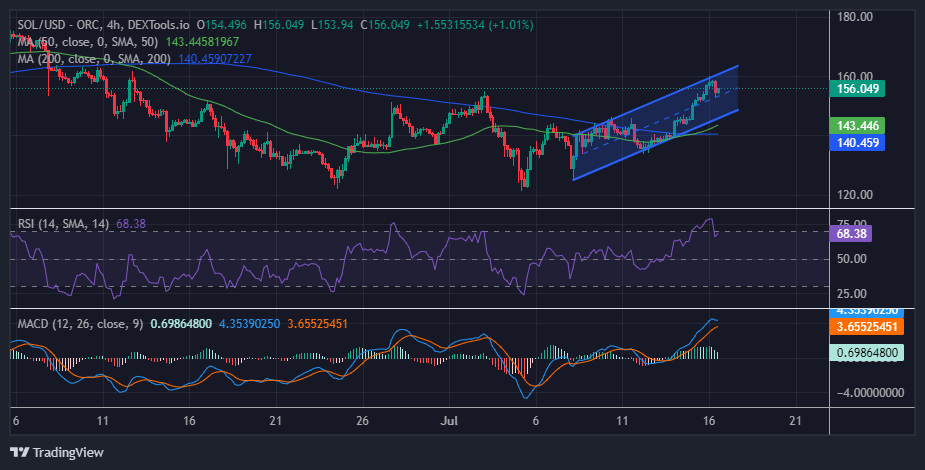
Notably, the Relative Strength Index(RSI) has its strength at 68, hurtling towards the 70-overbought zone. Increased buying pressure will see the RSI jump towards the overbought zone, reinforcing the bullish thesis in the market.
On the other hand, the Moving Average Convergence Divergence(MACD) in (blue) has crossed above the signal line, suggesting dwindling selling pressure. The golden cross indicates a shift in the SOL market from bearish to bullish.
Solana Price Prediction: Solana Bulls Eye The $180 Mark
According to the 4-hour chart analysis, the selling momentum is dwindling as the buyers have the upper hand. If the buyers capitalize on the Golden Cross formed around the $1400 mark, they could push the price above its technical resistance at the $163 mark. In a high bullish case, the buyers might push the Solana price above the $180 mark or set new ATHs in the coming days.
On the flip side, the Solana price could dwindle if the bears step into the market at this level. It could trade below the lower trendline of the rising channel at $144. In a dire case, increased selling pressure could se the SOL price breach the 50-day SMA and 200-day SMA to the $139 mark.
Advertisement


