Solana Price Analysis: SOL Could Rebound to $157 Mark, as Bulls Show Resilience

Cryptocurrency trading is speculative and your capital is at risk when you trade. We may earn affiliate commissions from some of the products on this page - at no extra cost to you.

Despite the broader crypto market’s downturn, the Solana price is showing resilience on the charts today. The altcoin is down 6%, with the SOL/USD trading at $128. However, it has hurtled from its daily low of $110, indicating a 15% increase. Its 24-hour trading volume has surged 286% to $13 billion, indicating intense market activity. This comes as an unknown wallet transferred 1.4 million SOL to Binance, worth over $173 million, as per Whale Alert.
🚨 🚨 🚨 🚨 🚨 🚨 🚨 1,400,000 #SOL (173,981,673 USD) transferred from unknown wallet to #Binancehttps://t.co/csVBJivcr3
Advertisement
— Whale Alert (@whale_alert) August 5, 2024

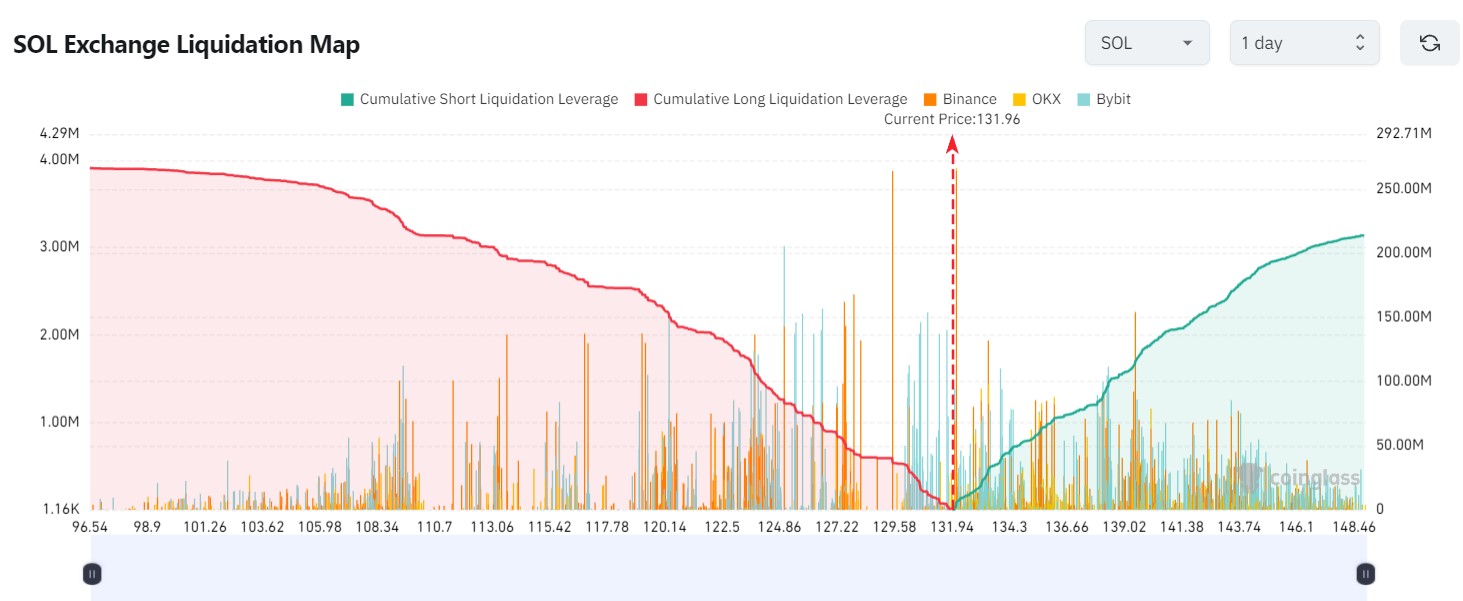
Meanwhile, data from CoinGlass shows sellers’ exhaustion, which could trigger a shift in momentum. The long positions in SOL are comparably higher than the short positions, suggesting a shift from bearish to bullish.
Solana Statistical Data
Based on CoinmarketCap data:
- SOL price now – $128
- SOL market cap – $59 billion
- SOL total supply – 581 million
- SOL circulating supply – 465 million
- SOL ranking – #5
Solana Bulls Poised for a Rally Above $157 Mark
Like other altcoins, Solana’s price has flipped bearishly today. However, all hope is not lost, as it has recorded a green candlestick in the 4-hour chart timeframe. This indicates that the bears are exhausted after dwindling the price to a low of $110 over the weekend. Currently, the price trades well at $128, with the bulls showing no signs of slowing down in the market. Let us dive into the technical outlook to see how high the SOL price could rally or whether the bears will step in.
To start with, SOL price trades below the 50-day(green) and 200-day(blue) Simple Moving Averages (SMAs). In this case, the $157 and $163 act as immediate resistance keys, suppressing the bulls against upward movement. However, with the bulls showing stamina at this level, they might flip the technical barriers into support, propelling the price to higher levels soon.
In the same way, the Relative Strength Index(RSI) has hurtled from the 30-oversold region, currently at 38. Although it is under the 50-mean level, increased buying pressure could see the RSI jump, with the momentum indicator pointing to the north.
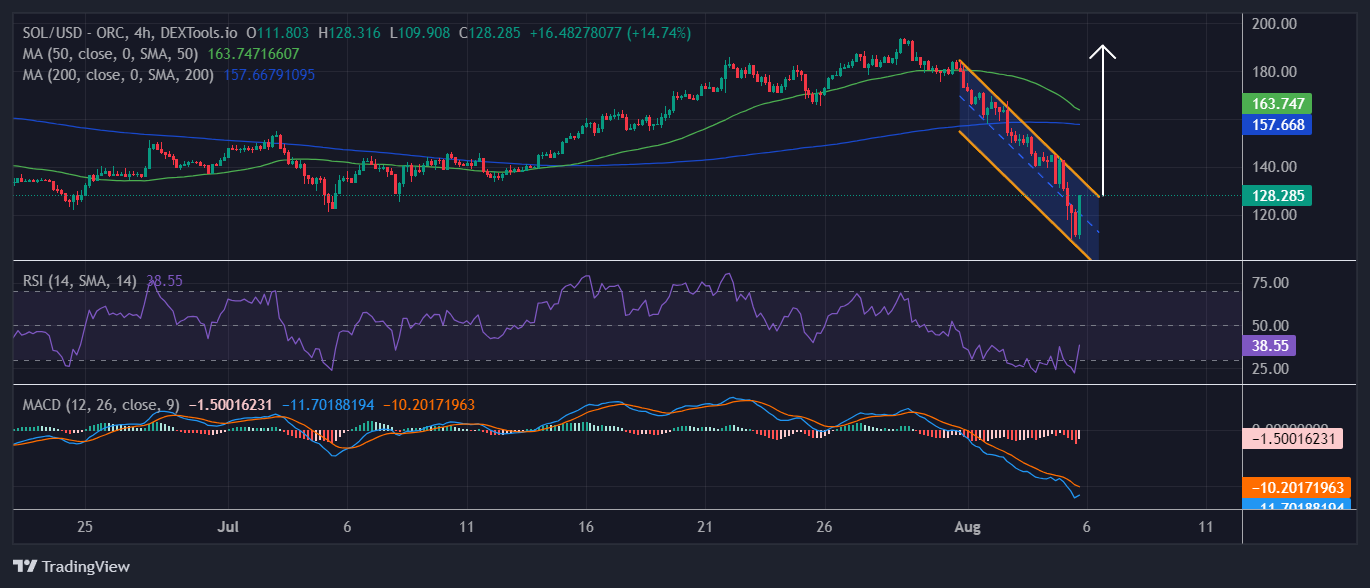
On the other hand, the Moving Average Convergence Divergence (MACD) is teasing with a buy signal in the market. However, this will only be executed if the MACD indicator crosses above the signal line (orange band). Meanwhile, the MACD line crossing below the signal line suggests that the short-term moving average falls faster than the long-term moving average.
Solana Price Future Outlook
In the 4-hour chart analysis, the bulls seem to be gaining momentum, and the selling pressure dwindling. If the bulls keep building stamina at this level, the SOL price could climb further, above the technical barriers. In such a case, if the MACD momentum crosses above the signal band, a buy move could be initiated. This could mean that the price of SOL will soar to around $157 in the next 24 hours.
In a highly bullish scenario, the bulls might flip the 200-day SMA into support, triggering a rally in the next 48 hours. This could see the SOL price at $190. Conversely, if the sellers step into the market and the overall outlook turns negative, the SOL price could drop. In such a case, the price of SOL could retest the $110 support level.
Advertisement


