Sign Price Surges 1% as Analyst Highlights a Potential ATH Soon

Cryptocurrency trading is speculative and your capital is at risk when you trade. We may earn affiliate commissions from some of the products on this page - at no extra cost to you.

Highlights:
- The sign price boasts a 1.90% increase, to $0.09.
- Its daily trading volume has soared 35%, indicating increased market activity.
- Sign technical indicators boast a bullish outlook, suggesting further upside.
The SIGN price shows signs of life, surging 1.90% to $0.09. The daily trading volume has increased 38% to $161.77M, indicating intense market activity among traders and investors. Meanwhile, the crypto market has seen an increase, as BTC, ETH, and XRP boast significant gains. The token is currently consolidating within an ascending parallel channel, which is a sign of bullish strength.
Advertisement

Sign Price Outlook
Currently, the Sign price is exchanging hands at $0.09, as the bulls target higher levels. According to the 1-hour chart outlook, the bulls have flipped the $0.08 into support, coinciding with the 50-day MA. If this support zone holds, the bulls could gear up for further upside, towards the $0. 095.
A quick look at SIGN technical indicators shows a bullish outlook. The Relative Strength Index has surged above the 50-mean level, currently at 62.32. This shows increasing buying activity in the SIN market. Meanwhile, there is still more room for the upside before the SIGN token is considered overbought.
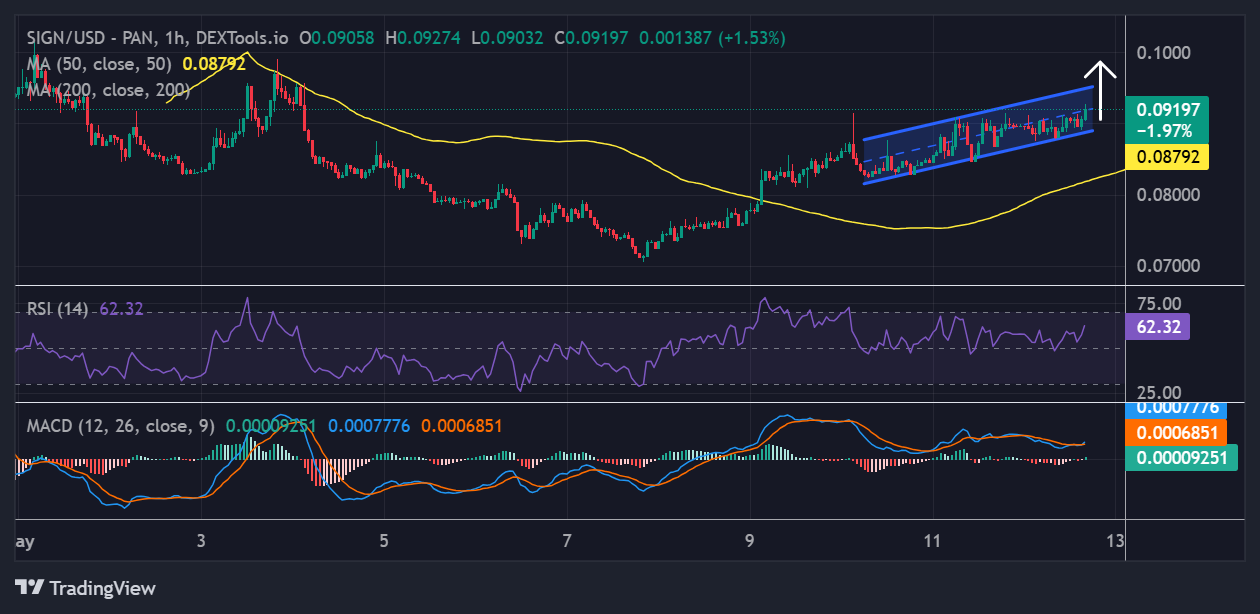
Notably, the Moving Average Convergence Divergence (MACD) has made a bullish crossover, calling for traders and investors to buy more SIGN. Affirming the bullish outlook, the blue MACD line is flirting above the neutral level in the positive region. Traders and investors are at liberty to buy more SIGN, unless the MACD changes.
Meanwhile, Frielien. sign, has highlighted via X post that SIGN price would be gearing towards a breakout to ATH soon. According to the analyst, the Sign price is closely consolidating near its highs. The token shows impressive strength on the charts, solid structure, growing volume, and increasing holder confidence. ‘’If momentum continues, we may be staring at an ATH breakout soon.’’
Watching $SIGN closely as it consolidates near its highs.@sign is showing impressive strength on the charts solid structure, growing volume, and increasing holder confidence.
If momentum continues, we may be staring at an ATH breakout soon.
A signal worth watching.#SIGN… pic.twitter.com/ZGa2viNydV
— Frieren.Sign (@frieren_sol_0) May 12, 2025
Sign Derivatives Data
The sign derivatives data analysis shows a positive outlook, such as painting a bullish picture. Sign’s volume has spiked about 6.68% to $128.62M, indicating increased investor confidence. On the other hand, open interest has spiked 2.45% to $36.24. This suggests increased market activity and an intense flow of money into the sign market.
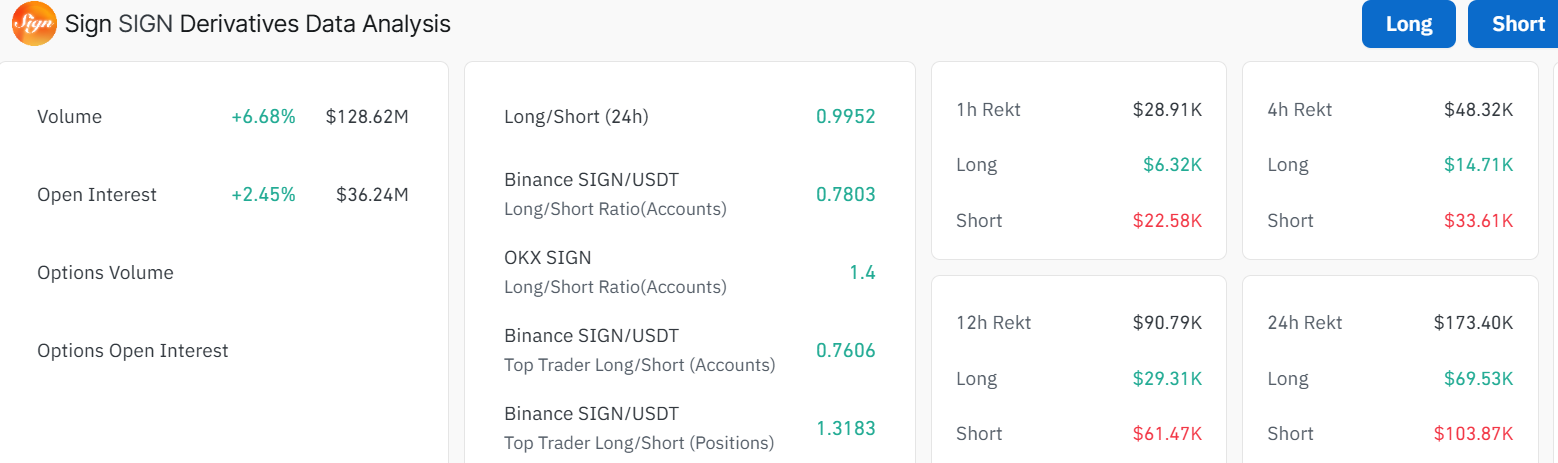
Moreover, the sign long-to-short ratio spiked towards the 0.99 mark. If it flips above 1, it would further bolster the bullish outlook in the market. In the meantime, if the support levels hold, the Sign price could surge towards $0.095 or above to $0.096.
However, in the case of early profiteering, the token may plunge towards lower levels. This will cause the sign price to drop to $0.092. If this level gives way, a deeper correction towards the $0.088 support level will be in line to absorb the selling pressure. A breach below this level will invalidate the bullish sentiment, which may trigger panic selling. Traders and investors need to be cautious and closely monitor the immediate support and resistance zones in the market.
![]()
eToro Platform
Best Crypto Exchange
- Over 90 top cryptos to trade
- Regulated by top-tier entities
- User-friendly trading app
- 30+ million users
![]()
eToro is a multi-asset investment platform. The value of your investments may go up or down. Your capital is at risk. Don’t invest unless you’re prepared to lose all the money you invest. This is a high-risk investment, and you should not expect to be protected if something goes wrong.
Advertisement


