Shiba Inu Price Prediction As SHIB Burn Accelerates, Is $0.00003 the Next Stop?

Cryptocurrency trading is speculative and your capital is at risk when you trade. We may earn affiliate commissions from some of the products on this page - at no extra cost to you.

Shiba Inu (SHIB), a popular meme coin, has seen a notable price increase of 0.58% over the past 24 hours after bullish trading activities. The meme coin hovered at $0.00001707, with a slight surge of 1% during the US trading session, indicating a market recovery.
With a market capitalization now at $10.06 billion, SHIB ranks 13th among cryptocurrencies, suggesting a resurgence of investor interest. The 24-hour trading volume for Shiba Inu reached $200.72 million. This significant trading activity indicates a high level of investor interest and market dynamics surrounding this cryptocurrency.
Advertisement

Shiba Inu Price Prediction: Navigating Through Market Volatility
In the past week, Shiba Inu demonstrated a mix of minor ups and downs, maintaining a mostly stable price range between $0.000018 and $0.000016. Despite the narrow fluctuation, SHIB managed a slight increase of 1.29%, indicating a phase of market consolidation rather than significant movement.
The broader crypto market, including Shiba Inu, has faced subdued activity. This past month, the overall downturn was 32%, underlining a challenging period for digital assets. However, leading cryptocurrencies like Bitcoin and Ethereum have recently shown signs of recovery. Bitcoin’s price climbed by about 3%, and Ethereum saw a 2% rise.
These gains among major cryptocurrencies may influence smaller coins like Shiba Inu and other meme-based digital assets, potentially steering them toward a recovery phase in the volatile market. This context sets a critical backdrop for Shiba Inu as it navigates through ongoing market pressures and attempts to regain momentum.
SHIB Burn Rate and Its Impact on Market Price
SHIB has recently garnered significant attention due to a dramatic increase in its token burn rate. Shibburn’s latest figures show a whopping 918.07 million SHIB tokens were destroyed in June through 237 separate transactions, resulting in a 148.69% rise in the monthly burn rate.
🔥🔥🔥 918,079,655 $SHIB tokens have been burned in the month of June with 237 transactions. #SHIB pic.twitter.com/vSkZgX8WGh
— Shibburn (@shibburn) July 1, 2024
Moreover, today’s figures are even more remarkable, with 301.68 million tokens burned, leading to a massive 1392.60% increase in the daily burn rate. This substantial reduction in circulating supply highlights the community’s active participation in managing the token’s availability and potentially boosting its value.
Technical Indicators and Future Predictions
The meme coin Shiba Inu faces significant resistance at the $0.000018 mark. A push beyond this level could elevate its price to $0.000019. This scenario may set the stage for SHIB to hit the $0.00003 threshold, signaling a bullish pattern in the upcoming period.
Conversely, Shiba Inu might retreat to a support position at $0.000017 if selling pressure increases. A shift in market mood to the negative could further decline its value to $0.000015. Such a downward trajectory would confirm a bearish trend, reflecting increased pessimism among investors.
The 4-hour technical indicators for Shiba Inu (SHIB) show a consistent sideways trend. The MACD (Moving Average Convergence Divergence) hovers near the baseline, suggesting a balance between buyers and sellers without significant momentum.
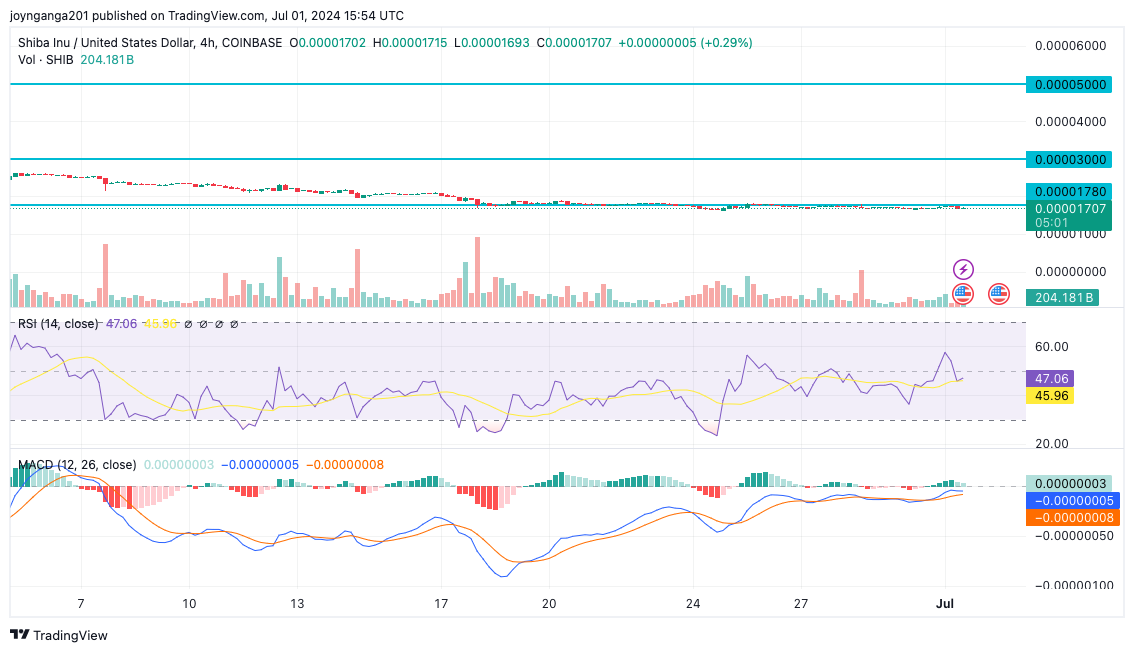
The RSI (Relative Strength Index) remains neutral, oscillating around the 47 mark, indicating neither overbought nor oversold conditions. The 50-Exponential Moving Average (EMA) has surpassed the 20-EMA, indicating a potential change in the trend direction. This technical crossover suggests that the longer-term momentum is gaining strength over the shorter-term trend.
Learn More
- Tether Enables USDT Payments for Philippine Social Security
- Best Meme Coins to Watch Closely in July 2024
- Is It Too Late To Buy SOL? Solana Surges 4% As It Becomes The Leading NFT Blockchain
- DePIN Crypto Projects to Watch In 2024 – Top 10 DePIN Coins
- Best Metaverse Coins to Invest – Next Metaverse Coins

Advertisement


