Sei Price Surges 13%, Is ATH Possible This Week?

Cryptocurrency trading is speculative and your capital is at risk when you trade. We may earn affiliate commissions from some of the products on this page - at no extra cost to you.

Highlights:
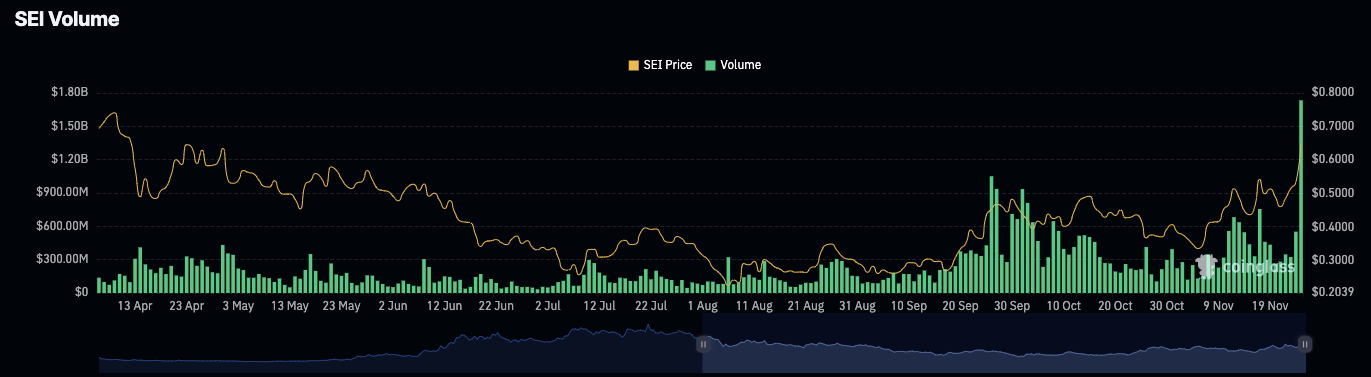
- Sei trading volume surges 204%, indicating rising investor interest.
- Derivatives market volume jumps 220.42%, signaling increased trading activity.
- Sei Price soared by 13% In the past 24-hours, indicating a bullish trend.
Sei price has recently recorded a notable surge, positioning the Layer 1 blockchain among the top-performing cryptocurrencies today. This impressive price movement comes as Sei trades within an ascending triangle pattern, a formation often associated with bullish momentum. The increase highlights growing investor confidence and reflects positive sentiment surrounding the blockchain’s potential in the market.
Advertisement

Sei Price Eyes ATH Amid Surge
Over the past 24 hours, the price of Sei price has increased significantly, rising by 13.37%. The cryptocurrency’s value reached $0.6438 as of the latest update, showcasing notable growth within a single day. SEI saw its lowest price during the period at $0.5084, while its highest point touched $0.6893. Most of the cryptos are trading in a bullish trend, with Bitcoin hovering around $98k
This surge highlights a promising recovery for SEI despite being 44.05% below its all-time high of $1.14, recorded on March 16, 2024. On the brighter side, SEI’s performance marks a staggering 7,896.67% increase from its all-time low of $0.007989, recorded on August 15, 2023.
Trading volume across the SEI market has exploded, up 204%, signifying increasing investor interest and participation in the space. According to data from CoinMarketCap, SEI now has a market capitalization of around $2.75 billion and ranks 50th in market capitalization among cryptocurrencies.
Over the past week, SEI’s price has climbed by 25%, reflecting strong market momentum. The monthly performance is even more impressive, with a notable 75% price surge recorded.
Sei Network’s derivatives market is witnessing a sharp uptick, showcasing significant growth in trading activity. Recent data indicates that the trading volume has soared by an impressive 220.42%, reaching $2.1 billion.
Alongside this surge was the open interest in derivatives, which jumped by 15.35 percent to a total of $271.42 million. Open interest is on the rise as traders are participating and very confident. However, the trading volume for options should have been disclosed in detail. This growth highlights Sei Network’s expanding presence in the cryptocurrency derivatives market.
Can Sei Price Hit $1 This Week?
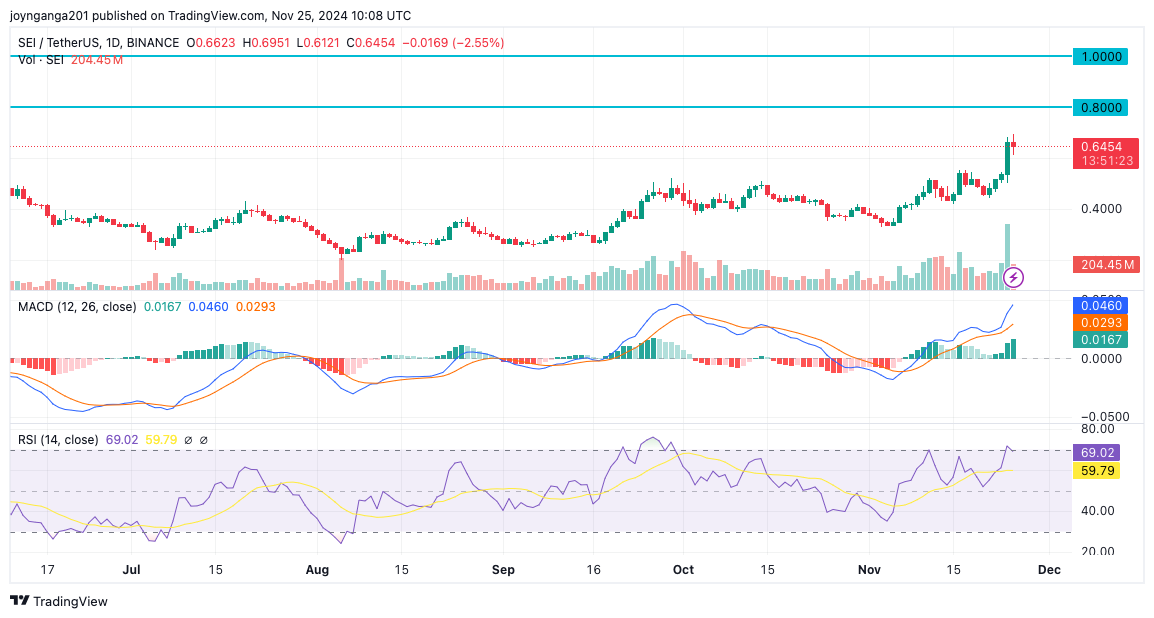
The Sei price faces strong resistance at the $0.70 level, a key hurdle for further upward movement. Breaking this barrier could push SEI toward $0.80, signaling bullish momentum. If the price reaches $0.80, it may pave the way for SEI to test the $1 mark. This upward trend could indicate growing optimism among investors in the coming days.
However, if sellers gain control, Sei’s value may decline to $0.60, a critical support level. A shift in sentiment could push it further down to $0.50. This drop would reflect bearish pressure and increased market pessimism.
The daily technical indicators for the Sei price suggest a bullish sentiment, indicating a bullish trend. The Relative Strength Index (RSI) stands at 69, nearing the overbought zone, which signals potential resistance. Meanwhile, the Moving Average Convergence Divergence (MACD) shows a positive trend. The MACD line stays above the signal line, indicating bullish momentum. The histograms have consistently demonstrated increasing green bars, indicating growing buying pressure.
The moving averages in the 4-hour chart highlight buying momentum. Currently, the 20-period and 50-period moving averages are sloping upwards. Although these averages persist below the current price level, this indicates a bull outlook.
The up trend suggests a merger of this happy news with the upward momentum in the market. These moving averages are positive on a slope, further reinforcing the odds of continued buying pressure.
Advertisement


