Saga Price Surges 55% in a Week as Analyst Predict A Bull Rally Breakout Potential

Cryptocurrency trading is speculative and your capital is at risk when you trade. We may earn affiliate commissions from some of the products on this page - at no extra cost to you.

The saga price has surged over 55% in the past week and 20% in the past 24 hours to trade at $1.81 as of 5:37 am EST on a 248% surge in trading volume to $180 million, pushing the market cap to $160 million. The SAGA price has been generally bearish over the longer term, but buyers have shown strength recently. The price had been following a descending trendline, creating a pattern of lower lows and lower highs.
$SAGA
SAGA grew because a lot of OI came in.
It's too late to take a long trade now. High chance of a deep pullback…Advertisement
I would look for LONG after the price builds a local range.#SAGA pic.twitter.com/AjCbXtjEdk
— Yuriy 🔶 BikoTrading | OrderFlow Trader (@Yuriy_Biko) August 13, 2024

However, SAGA has broken out of this trendline. The chart indicates that the bulls have been performing well over the past 30 days and appear to be gaining strength. Following this breakout, the price is anticipated to reach $3.85. Buyers could continue to dominate. A successful inverted head and shoulders pattern might signal a trend reversal, potentially leading the price to reclaim the $6 mark in the coming months.
Saga Price Statistics
- Saga Price: $1.81
- Market cap: $160 million
- Trading volume: $180 million
- Circulating supply: 99 million
- Total supply: 1.03 billion
Saga Bullish Sentiment Continues Remaining Strong
The Saga price has recently experienced a downward trend, pushing the price low to a support level of $1.58. The daily chart shows the possibility of the bulls regaining strength due to the formation of a bullish flag pattern that indicates an upcoming bully rally.
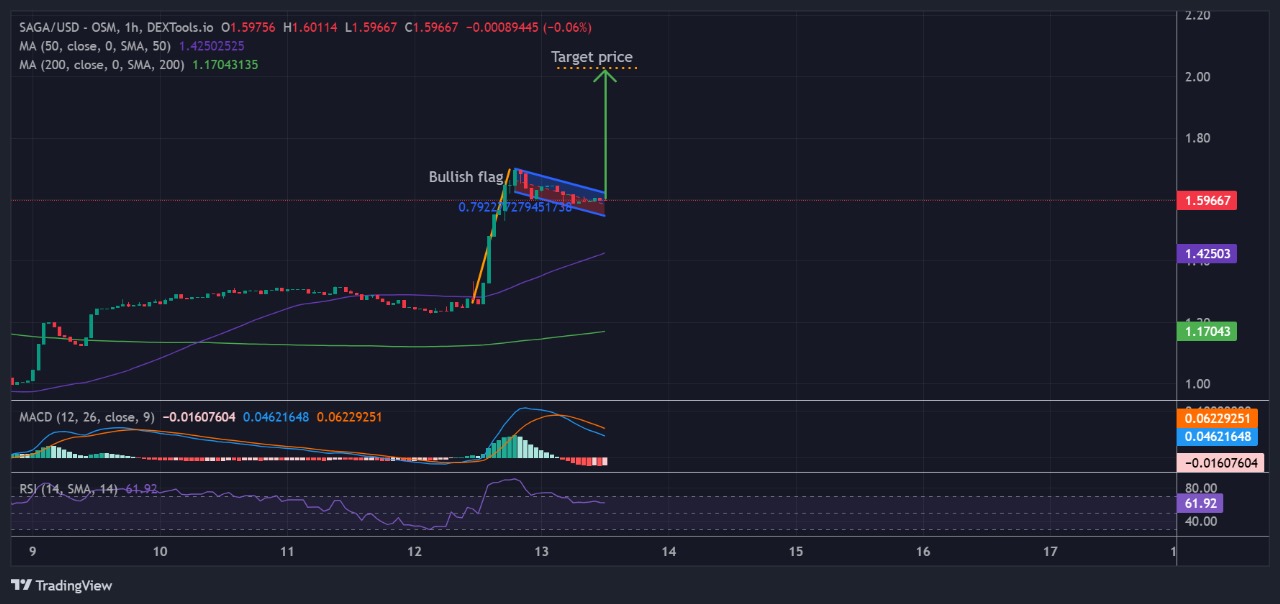
The daily chart displays strong indications of a potential bullish crossover. The market trades key resistant levels above the 50-day and 200-day simple moving average (SMA). This act has solidified the overall bullish trend, which, in turn, favors buyers.
The Relative Strength Index (RSI) also supports the upcoming bully rally. The RSI is currently holding above the 50 mid-line level and is forming a slight uptrend towards the 70-overbought zone. A rise above the 70-overbought level would signal a strong increased buying pressure and further validate the bullish sentiment. If the RSI surpasses the 70-overbought level and continues rising, the market will create a new all-time high.
Furthermore, the moving average convergence divergence (MACD) supports a bullish outlook. The MACD line (blue) is rising and poised to cross above the orange signal line, which is currently declining. Additionally, the red histogram bars are diminishing in color intensity and size, reducing bearish momentum and reinforcing the potential for a bullish rally. This confluence of indicators suggests an increased probability of a significant bullish crossover and a strengthening market trend.
Saga Price Prediction
According to the chart, SAGA’s price has been bearish over a longer period, with sellers dominating in the short term. However, an inverted head and shoulders pattern has formed at the bottom, suggesting a bullish outlook. Additionally, the chart shows a shooting star candlestick in the lower high area, signaling potential selling pressure ahead.
The bulls demonstrate a significant strength by driving the price up after regrouping at the $1.58 support level. They aim to continue pushing the market higher, targeting a price of $3.85. On the other hand, if the bears try to regain momentum, they will pull the price to $1.46, which will favor sellers.
Advertisement


