Render Price Surge Faces Uncertainty Following Declining Whale Activity- Will the Price Rally to $11?

Cryptocurrency trading is speculative and your capital is at risk when you trade. We may earn affiliate commissions from some of the products on this page - at no extra cost to you.

Highlights:
The Render price has surged 10% in the past 24 hours to trade at $9.81 as of 6:30 a.m. EST on an 8% drop in trading volume to $434 million. Render continues solidifying its position as the leading AI-focused cryptocurrency with a market capitalization nearing $5 billion.
Advertisement

Over the past 30 days, RENDER has gained 56%, outpacing competitors like FET and TAO. However, despite its recent price performance, on-chain data reveals warning signs that could hinder its upward momentum.
$RENDER is going to $30!
RSI has flipped! Last time it happened it pumped 900+%! pic.twitter.com/y9ZFGq9PQb
— Dami-Defi (@DamiDefi) November 18, 2024
Whale activity has declined significantly, a key driver of cryptocurrency market trends. The number of wallets holding between 100,000 and 1,000,000 RENDER coins has dropped to 151, the lowest level since December 2022. This decline suggests that large investors, or “whales,” are not accumulating during the current rally, indicating a potential lack of confidence in the sustainability of the price surge.
Whale Activity Declines and Momentum Weakens
Whales often play a critical role in driving bullish sentiment, and their reduced participation could limit RENDER’s ability to maintain its recent gains. Without strong whale support, RENDER may face increased selling pressure, potentially leading to a price correction.
Additionally, technical indicators highlight mixed signals about RENDER’s future trajectory. The BBTrend indicator has turned negative, suggesting weakening momentum, while EMA lines present conflicting possibilities, hinting at both bullish and bearish scenarios. These indicators point to a pivotal moment for RENDER, where the coin could either break into new highs or experience a significant pullback.
Despite its dominance in the AI coin market, RENDER’s future remains uncertain due to declining whale activity and weakening momentum. While the coin continues to draw attention with its impressive gains, the lack of support from large investors and mixed technical indicators should be a cause for caution. Investors should closely monitor whale movements and key technical signals to gauge the coin’s next potential move.
Render Statistics
- Render price: $9.81
- Market capitalization: $5 billion
- Trading volume: $434 million
- Circulating supply: 517 million
- Total supply: 532 million
Render Price Gears for a Rally Above the Triangle
The chart of the RENDER/USD pair on a 4-hour timeframe reveals a symmetrical triangle pattern, which is typically a sign of consolidation before a potential breakout in either direction. The current price is around $9.83, just below the psychological resistance level of $10.
Immediate support is found at $9, with the 50-day moving average at $9.67 providing additional support. In case of further declines, the 200-day moving average at about $8.06 is the next key level to look at. On the upside, the triangle’s upper trendline acts as resistance, and a break above this level might aim for $11 or higher.
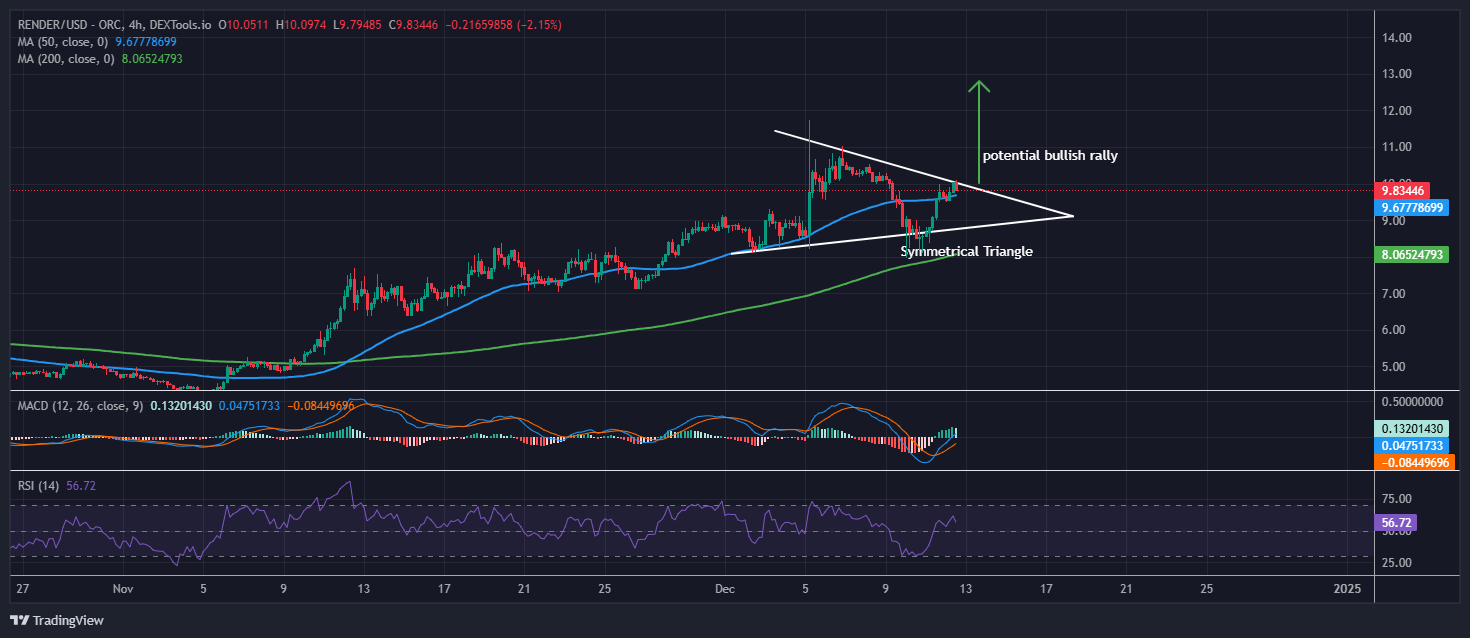
The technical indicators reflect mixed but mostly bullish signals. The symmetrical triangle suggests the possibility of a breakout. The price is above both the 50-day and 200-day moving averages, indicating the overall sentiment is bullish.
The MACD also reflects positive momentum, as the MACD line stands at 0.13 above the signal line of 0.05, further supported by positive histogram bars to indicate growing buying pressure. The RSI is at 56.72, within the neutral zone but slightly skewed toward the bullish side, indicating that there is still room for upward movement before reaching overbought conditions.
RENDER is consolidating within a symmetrical triangle, with the price at a crucial point where it could break out to the upside or downside. A breakout above $10 could lead to a rally toward $11 or higher, while a drop below $9 could result in a retest of lower support levels. Traders should closely monitor the price action around these key levels to gauge the next major move.
![]()
eToro Platform
Best Crypto Exchange
- Over 90 top cryptos to trade
- Regulated by top-tier entities
- User-friendly trading app
- 30+ million users
![]()
eToro is a multi-asset investment platform. The value of your investments may go up or down. Your capital is at risk. Don’t invest unless you’re prepared to lose all the money you invest. This is a high-risk investment and you should not expect to be protected if something goes wrong.
Advertisement


