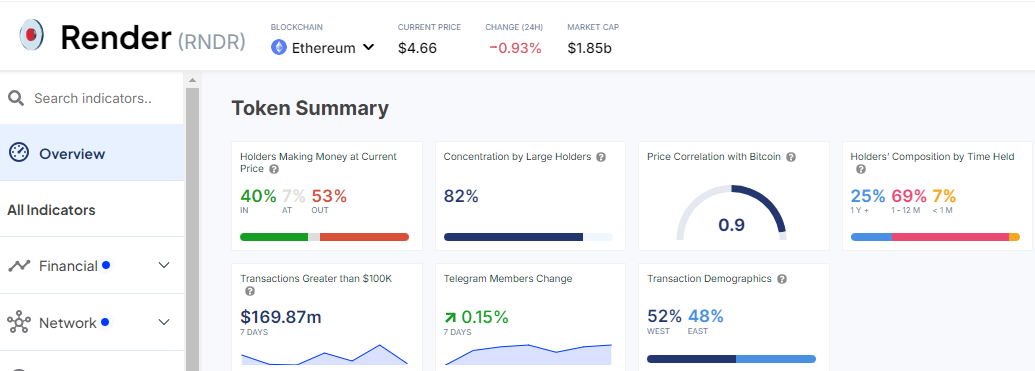
Render (RENDER) price, the leading provider of decentralized GPU-based rendering solutions, stands out with a market cap of $1.80 billion. As Render experiences a sharp decline, questions arise about the potential reasons behind the sell-off. The Render token is down 4% at press time, with the RENDER/USD trading at $4.60.
The token has fallen almost 1% in the past week and 27% in the past month. However, it is up 172% in a year as its 24-hour trading volume surged 4% to $44 million. This suggests intense market activity among traders and investors. Meanwhile, data from Coinglass shows that short positions are comparably higher than long positions. This suggests that the bearish stance is still dominating the market.

Moreover, data from Into the Block shows that around 40% of holders are in profit compared to the 53% who are staggering in losses.

Render Price Statistical Data
Based on CoinmarketCap data:
- RENDER price now – $4.60
- RENDER market cap – $1.80 billion
- RENDER total supply –532 million
- RENDER circulating supply – 392 million
- RENDER ranking – #46
Render Technical Indicators Flash Bearish
The Render price has been in a prolonged downtrend since 23 May as the bears dominate the market. Currently, the token is trading with a bearish bias within the confines of descending parallel channel. The bears have taken advantage of the death cross made on July 18 at around $7.58, dwindling the price in a downtrend. Moreover, the technical indicators paint the big picture bearish, tilting the odds in favor of the seller.
Based on the 50-day and 200-day Simple Moving Averages (SMAs), the bulls must conquer the hurdles at $6.04 and $7.90 before the next leg up. In this scenario, bulls must deal with the immediate resistance keys to initiate a rally.

The Relative Strength Index notably upholds the bearish outlook as it roams around the 30-oversold zones. Currently, at 39, the Bears have the upper hand as bulls are nowhere to be seen. However, if the buyers capitalize on the oversold token, they might accumulate more RENDER, seeing the RSI jump to the overbought floor soon.
On the other hand, the Moving Average Convergence Divergence (MACD) gives hope to the Render traders and investors. The momentum indicator has flipped above the signal line in orange, calling for traders to book positions in the market. As the MACD indicator gradually ascends above the mean line (0.00) into the positive region, the path with the least resistance stays on the upside.
Will the Render Bulls Trigger an Uptrend?
According to the technical analysis in the 1-day chart above, the odds favor the sellers. If the bears capitalize on the 50-day and 200-day SMAs, the price of RENDER could drop. A breach and break below the lower trendline could cause the price to plummet to around $4.22.
Conversely, the RENDER price could soar if the buyers initiate a buy-back campaign with the MACD indicator suggesting a buy signal. Moreover, with the token already oversold, the bulls might take advantage of that and accumulate more Render. In such a scenario, the bulls could target the $7.27 mark. In a highly bullish case, the $7.90 resistance could be turned into a support floor, as the bulls target $10.


