Raydium Price Pumps 26% in a Week Following Bithumb Listing – How High Can Ray Go?

Cryptocurrency trading is speculative and your capital is at risk when you trade. We may earn affiliate commissions from some of the products on this page - at no extra cost to you.

Highlights:
- Raydium price has slightly plunged 1% to trade at 5.78 as trading volume plummets.
- Raydium has obtained a listing on Bithumb, one of the largest crypto exchanges in South Korea.
- Full trading for RAY tokens will begin at 5:00 PM KST on Tuesday, November 19, giving users access to the new pairs.
Raydium’s price has experienced a significant surge after being listed on Bithumb, one of the largest South Korean crypto exchanges. However, early profiteering commenced causing RAY to plunge 1% to trade at $5.78 during European trading sessions. Its daily trading volume has reached $173 million, with a market cap of $1.69 billion, showing a slight plunge in this Solana-based AMM protocol. Despite the plunge, RAY is up 26% in a week, 158% in a month, and 1418% in a year.
Advertisement

Meanwhile, according to a November 19 announcement, Bithumb has officially added Raydium (RAY) and Ponke (PONKE) to its KRW pairs. The trading support for RAY and PONKE on the Solana network allows users to deposit and withdraw within three hours of the announcement. Full trading for both tokens will begin at 5:00 PM KST on Tuesday, giving users access to the new pairs as trading officially starts.
GM Fam ☀️!
Top Korean exchange Bithumb announces the listing of $RAY and $PONKE.
The market is buzzing, folks! pic.twitter.com/KV1lcKLOWl
— Maska 🎭 (@0xMaska) November 19, 2024
Raydium Statistical Data
Based on CoinmarketCap data:
- RAY price now – $5.78
- Trading volume (24h) – $173.23 million
- Market cap – $1.69 billion
- Total supply – 555 million
- Circulating supply – 290.94 million
- RAY ranking – #62
The Raydium price is currently trading at $5.76, marking a slight plunge of 1% following its listing on Bithumb. In the past 24 hours, RAY’s price ranged from a low of $5.50 to a high of $6.16 before early profit bookings commenced, causing the price to fall to $5.76. However, RAY still trades within the confines of a rising parallel channel, indicating bullish prospects.
The bulls have taken the reigns, flipping the major bullish indicators, including the 50-day and 200-day SMAs, into support. In this case, the $2.09 and $03.16 act as immediate support levels, steadying the upward trajectory in the market. Reinforcing the bullish sentiment is the Golden Cross, often identified when the short-term (50-day) crosses above the long-term (200-day), signaling a long-term bullish thesis.
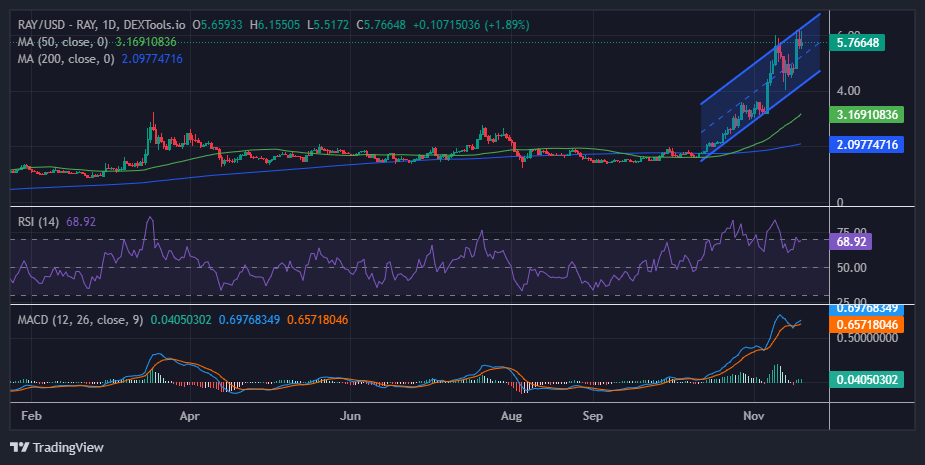
The RSI notably hurtled from the 50-mean level, jumping to the 71-strength level, before retracing to 68.92. Despite the slight retracement, the bulls still show strength, giving the buyers the upper hand.
The Moving Average Convergence Divergence (MACD) is also in positive territory, still above the orange signal line. This indicates buyer momentum still exceeds selling pressure, calling for traders to rally behind Raydium’s price.
Raydium Price Forecast
The Raydium price flaunts a bullish picture in the daily chart timeframe, showing increased buying appetite. At this level, if the support levels ($2.09 and $3.16) stay intact, bulls could seize the opportunity to push the Raydium price to reclaim the $6.16 mark. In a highly bullish case, the gains could extrapolate to $10.
Conversely, the falling RSI shows momentum falling. If the $4.64 gives way, the Raydium price could fall through. Nevertheless, the bullish sentiment for the RAY price would only be invalidated below the $2.09 support. Such a move would also indicate a change in market structure.
Advertisement


