Popcat Price Gains Momentum as Analyst Predicts Further Growth

Cryptocurrency trading is speculative and your capital is at risk when you trade. We may earn affiliate commissions from some of the products on this page - at no extra cost to you.

Highlights:
- Popcat Surges 13%, with the meme coin showing strong bullish signals.
- The analyst predicts further growth, targeting $4 or above in the near term.
- Open Interest and volume increase, indicating renewed interest in Popcat.
The Popcat price has exploded in a splendid show of bullish muscle, with 24-hour gains reaching 13%, as POPCAT/USD is trading at $1.58. The growing interest in the token has seen the trading volume spike by 13% to $223.18 million, while the market cap is up 13% to $1.54 billion. POPCAT sits in the top 100, ranking #54 among other cryptos. POPCAT is now up 24% in a week and 67% in a month.
Advertisement

The meme coin’s surge in trading activities reinforces a positive sentiment in the market. Coinglass data shows bolstered investor confidence as the volume and open interest surge. Open interest is up 25% to $262.06M, while the volume has increased 51% to $1.14 billion. This suggests renewed interest in the memecoin, painting the bigger picture bullish.
Moreover, investors are optimistic about a price increase, as Popcat is performing great. According to Trade4Addict, he has mentioned via X that “Think we are already on the way to $4 and above.”
$POPCAT is performing great
We already took out the $1 and are consolidating below previous high at $1.57 right now
Think we are already on the way to $4 and above#POPCAT was and is is a great candidate for an altcoin portfolio pic.twitter.com/MVCJVBS8ga
— Trade4ddict (@Trade4ddict) October 24, 2024
With Solana meme coins continuing to break the ATHs, Popcat is also following. It has broken the $1.50 resistance, currently at $1.58, and is aiming for $2.
Popcat Statistical Data
Based on CoinmarketCap data:
- POPCAT price now – $1.58
- Trading volume (24h) – $223.18 million
- Market cap – $1.54 billion
- Total supply – 979.97 million
- Circulating supply – 979.97 million
- POPCAT ranking – #54
Popcat Shows Strong Bullish Signals and Expected to Continue the Rally
Over the last 24 hours, bulls have put their best foot forward, quashing the selling pressure and supporting an impressive rally to $1.5892. The Popcat price boasts splendid bullish muscle as the bulls entirely take the reigns in the market. This has resulted in the formation of an ascending parallel line, suggesting a bullish sentiment.
The buy orders seem to be accumulating in POPCAT which might see the price break above the pattern. Popcat price holds above most bullish indicators, with the 50-day SMA (green) and the 200-day SMA (blue) in line to offer support. Moreover, Popcat is in a resistance-free zone, which allows the rally to continue.
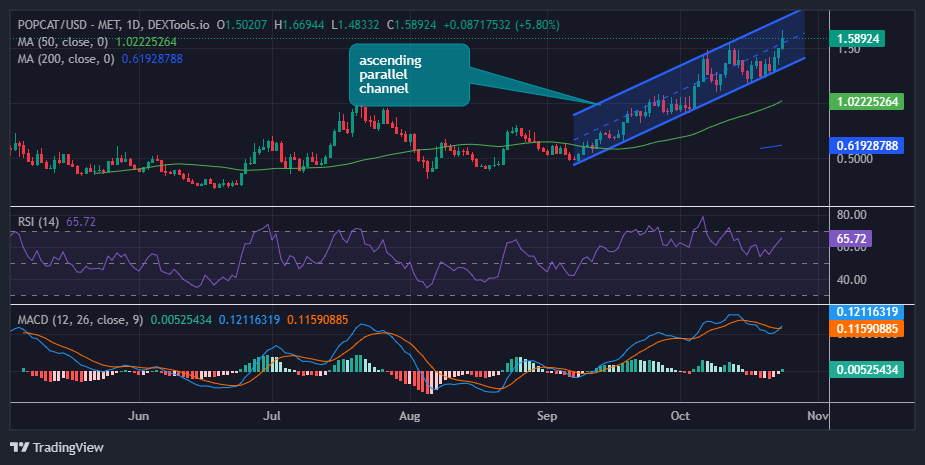
Based on the technical outlook as depicted by the Relative Strength Index (RSI), which measures the strength of an asset’s trend – either up or down, the bulls have the upper hand. This is manifested as the RSI sits above the 50-mean level at 65.77. Increased buying pressure will see the RSI jump to the 70-overbought region, bolstering the positive outlook.
The Moving Average Convergence Divergence (MACD) reinforces the bullish outlook. This is evident as traders sought exposure to POPCAT as the blue MACD line crossed above the orange signal line. In other words, traders will be inclined to buy as the MACD line stays intact above the signal line.
Popcat Price Outlook
According to the daily chart time frame technical analysis, all odds are in favor of the bulls. If the bulls capitalize on the technical indicators that call for traders to rally behind POPCAT, the price will continue with the upward movement. On the upside, POPCAT could record a new ATH, targeting $2
However, if the bulls exhaust the uptrend and give way to the bears, the price will drop. On the downside, investors might have to consider another sweep through lower support areas, such as the 50 SMA at $1.02.
Advertisement


