Polygon Price Plunges 7% as Analysts Predict a Surge on Technicals


The Polygon (MATIC) price has dropped 7% in the last 24 hours, now trading at $0.5422. This decline comes with a 72% increase in trading volume, reaching $246 million.
This drop comes as a World of Charts analyst predicts that Polygon could rise between $4 and $5 in the midterm. He noted that this might be the last chance to accumulate MATIC before a strong bullish wave, which he expects to happen soon. He also suggested that this surge for Polygon could occur during the upcoming altcoin season.
Advertisement

It Might Be Last Chance To Catch #Matic On This Low Before Massive #Alt Season Adding More In Portfolio & Expecting Solid Bullish Wave Towards 4-5$ In Midterm #Crypto pic.twitter.com/A0Yw0iy035
— World Of Charts (@WorldOfCharts1) June 20, 2024
Interestingly, the crypto analyst believes Polygon will rise well beyond $5 in the long term. Based on the chart he shared, he hinted that the token could climb as high as $40 by the end of the year or sometime in 2025.
Polygon is poised for a bullish reversal, with another crypto analyst, Mayor of Matic, noting a wedge pattern on the Polygon chart. He mentioned that a breakout above this wedge would be significant and powerful.
$MATIC resting trend.
3 years of price consolidation.
The breakout of this wedge will be powerful. pic.twitter.com/ofWG5am3TM
— THE MAYOR OF MATIC (@MayorOfMatic) June 14, 2024
Despite the drop, Polygon (MATIC) is showing bullish signals again after being bearish. These indicators suggest that the token could soon make a significant upward move.
Polygon MATIC Price Statistics
- MATIC price:$0.5422
- Market Cap:$5 billion
- Trading volume:$246 million
- Circulating Supply:10 billion
- Total Supply:10 billion
Is it Time to Turn Bullish on Polygon: Polygon (MATIC) Price Analysis
Polygon (MATIC) price shows signs of a potential bullish rally despite a recent downturn. This downturn has led to a falling wedge pattern, which typically signals a bullish trend reversal.
MATIC has declined since hitting the resistance level at the $1.26 zone. The bears have continually pushed the price down, but the bulls are eyeing the $0.4926 zone to regroup and drive the price upwards in a recovery effort.
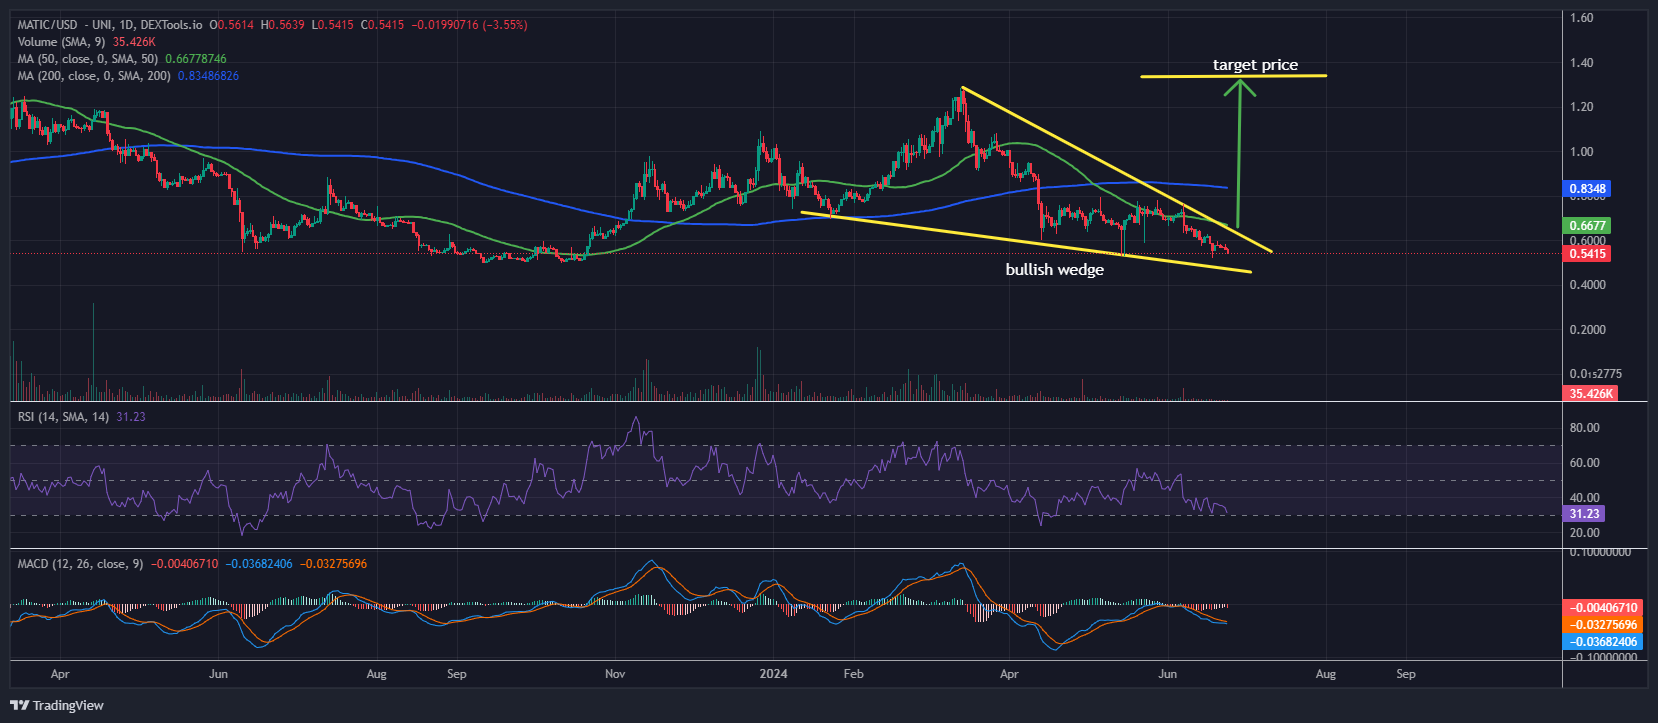
MATICUSD Analysis (Source: Dextool.io)
while MATIC is currently under bearish pressure, key indicators suggest that a bullish reversal could be on the horizon if the bulls can sustain their momentum.
MATIC is trading below the 50 and 200 simple moving averages (SMAs), reflecting a bearish trend. The moving average crossover at $0.8475 has strengthened this bearish momentum, pushing the price down from the upper trendline of the wedge.
However, the Relative Strength Index (RSI) offers hope, having rebounded from the oversold level of 30. If the bulls gain momentum, the RSI could rise to the midline of 50, signalling strong buying pressure.
The MACD indicator paints a mixed picture. It currently shows a slump at the neutral level, but there’s potential for a bullish shift as the blue average line crosses above the orange signal line. Additionally, green bars boost confidence in a possible price increase.
Polygon (MATIC) Price Poised for a Bull Rally
If the bullish momentum picks up, MATIC could surge towards its previous high of $1.26. However, should the bears continue the bearish move, the price might drop to $0.4926, aligning with the lower boundary of the wedge. Further downward pressure could push it below the wedge at $0.04029.
Final Thought
Overall, the current technical indicators suggest that MATIC is well-positioned for a significant bull rally, driven by the bullish momentum from the falling wedge pattern.
Read More
- 3 Key Issues Behind The Crypto Market Slumps and 3 Positive Signs to Watch
- 12 Best Crypto Exchanges In 2024


Advertisement


Charles Kibue
Charles Kibue is a cryptocurrency researcher and writer with published works on Crypto2Community and a range of other sites. He has also worked as a technical writer, researching NFTs and crypto projects. Charles is an English Literature graduate residing in Kenya. He possesses additional expertise in market analysis and offers accurate and reliable insights, staying up-to-date with the latest developments in the crypto industry. Beyond his professional pursuits, Charles enjoys hiking and horse riding in his leisure time.
View full profile ›ℹ️About Crypto2Community's Editorial Process
Crypto2Community's editorial policy is centered on delivering thoroughly researched, accurate, and unbiased content. We uphold strict editorial policy and sourcing standards, and each page undergoes diligent review by our team of top crypto industry experts and seasoned editors. This process ensures the integrity, relevance, and value of our content for our readers.


