Pepe Price Surges 13% as the Market Interest Spikes – Can It Maintain the Pace?


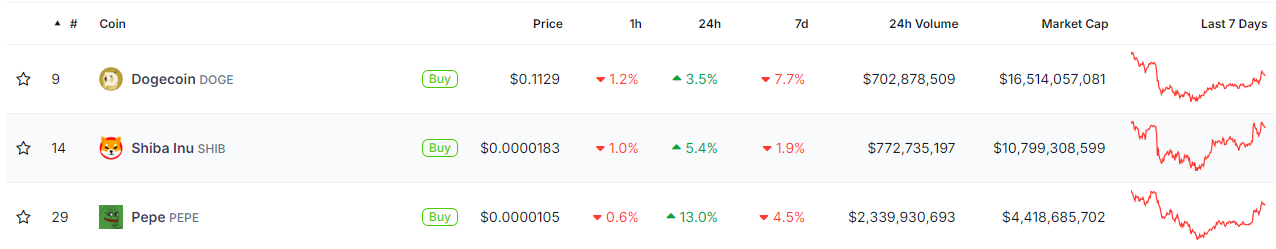
The Pepe price is upholding a splendid bullish muscle, as it has increased 13% in the past 24 hours, with the PEPE/USD trading at $0.00001. The growing interest in the meme coin has seen the trading volume spike by more than 102% to $1.12 billion, while the market is up 13% to $4.48 billion.
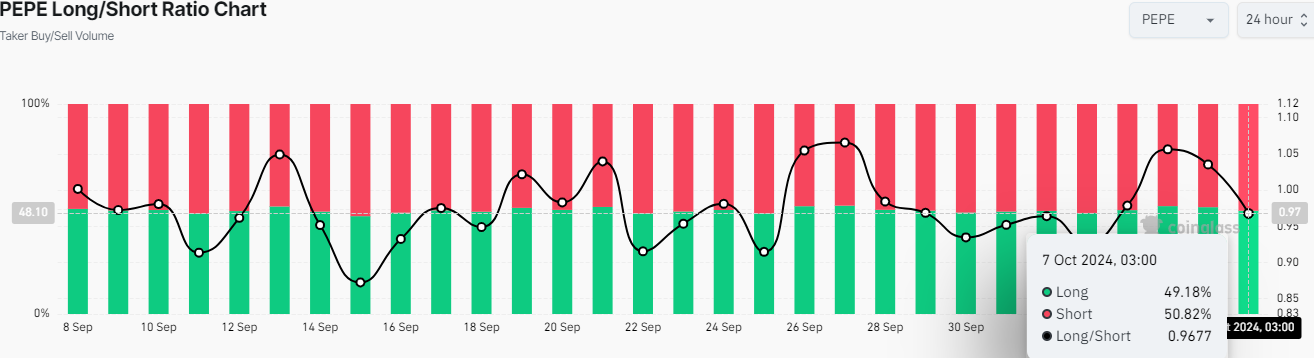
Despite the positive outlook, Coinglass data shows that the frog-themed meme coin has some bearish prospects. This is evident as the Pepe Long/Short Ratio has plunged below 1, currently at 0.96. In other words, a close above 1 indicates that the average open position is bullish, and vice versa. Currently, it sits at $0.96, suggesting that the average open position in the Pepe Market is bearish.
Advertisement

However, if Bitcoin stays bullish, Pepe might knock off a zero from its price. With $SHIB and $DOGE also rallying, meme coins are set to lead the charge.
Pepe Statistical Data
Based on CoinmarketCap data:
- PEPE price now – $0.00001
- Trading volume (24h) – $1.12 billion
- Market cap – $4.48 billion
- Total supply – 420.69 trillion
- Circulating supply – 420.69 trillion
- PEPE ranking – #23
Pepe Price Shows Elecritifying Movement Within the Confines of a rising Channel
The Pepe price looks extremely bullish today, as a vast October might be in the cards for the frog-themed meme coin. Pepe is rallying within the confines of a rising channel, painting the big picture in the market as bullish. Previously, Pepe dropped about 26% from the moment Iran fired missiles, causing tension in the crypto market. However, the meme coin bottomed out (October 3) with a splendid move above the 50 SMA at $0.00000997.
Meanwhile, the technical information suggests dwindling selling pressure, as the bulls have put their best foot forward. The bears are nowhere to be seen, as the bulls have established solid support at the 200-day and 50-day SMAs. The $0.0000084 and $0.0000099 act as immediate support keys, leaving the bulls in a resistance-free zone.
Moreover, the Golden Cross also validates the bullish picture in the market. A golden cross is valid when the short-term Moving Average (50-day SMA) moves above the long-term MA(200-day SMA). This suggests that traders are at liberty to hold their long positions in the Pepe market intact.
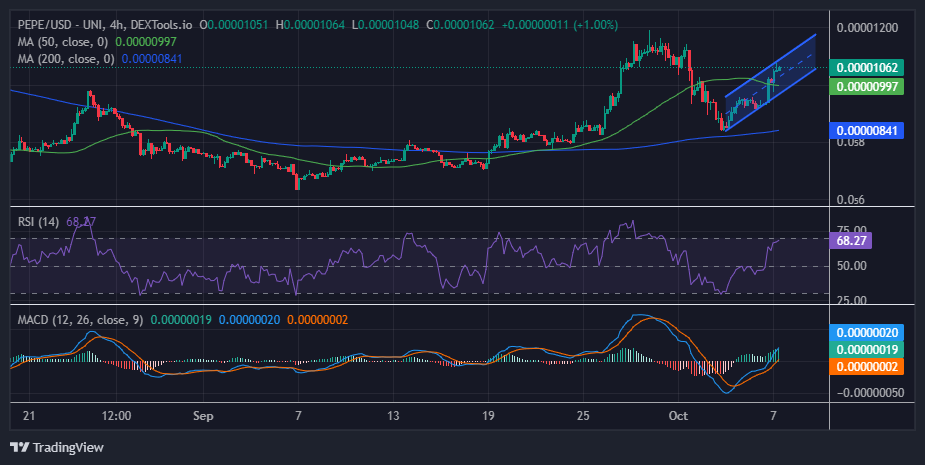
Meanwhile, the Relative Strength Index (RSI) sits at 68.27, almost hitting the 70-overbought zone. However, if the RSI jumps to the 70-overbought zone, it is prudent for traders to be cautious of a potential correction. Traders won’t have to worry about sudden pullbacks with the RSI above 70, as this position also means a correction is imminent.
On the other hand, traders should consider bagging PEPE, which manifests with the MACD line in blue, crossing above the orange signal line. As the momentum indicator gradually ascends above the mean line (0.00) into the positive region, the path with the least resistance stays on the upside. Moreover, the green histograms are increasing in size, quashing the selling pressure in the market.
Pepe Price Outlook: How High Can Pepe Go This October?
The Pepe bulls show strong upward momentum in the 4-hour chart timeframe, leaving the bears in total dust. Meanwhile, the Pepe price hit a high of $0.00001 after rebounding from a low of $0.0000084. With the strong buying sentiment in the cards, the pepe price could rally to $0.000011 before a retracing in search of enough liquidity.
Meanwhile, in case of a correction, the 50-day SMA, at $0.0000099, will absorb potential selling pressure. Moreover, increased selling pressure will cause the $0.0000099 support to break down, dwindling the price downwards. In such a case, the $0.0000091 support level will cushion against further losses. The 200-day SMA at $0.0000084 will absorb the intense selling pressure in a highly bearish case.
Advertisement


Emmaculate Araka
Emmaculate Araka is a cryptocurrency writer with published works on Crypto2Community and other news sources. She is believer in the transformative power of crypto and the blockchain industry, conducting on-chain analysis, breaking down market-triggering events, and helping traders and investors benefit from expert technical price analysis. Emmaculate finds gratification in diving deep into the crypto space, earning herself significant knowledge and experience. She holds a Bsc. in Information Science, and outside work, Emmaculate loves reading novels and watching documentaries.
View full profile ›ℹ️About Crypto2Community's Editorial Process
Crypto2Community's editorial policy is centered on delivering thoroughly researched, accurate, and unbiased content. We uphold strict editorial policy and sourcing standards, and each page undergoes diligent review by our team of top crypto industry experts and seasoned editors. This process ensures the integrity, relevance, and value of our content for our readers.