Pepe Price Struggles as Traders Short on PEPE: What Next for PEPE?


The Pepe price has slipped 3% today, with the meme token falling to $0.000007707. The crypto market has lost close to 2.5% in the past 24 hours. PEPE price has now dropped 7% in a week and 36% in a month, although the memecoin sector remains up by 2%, according to Coingecko.
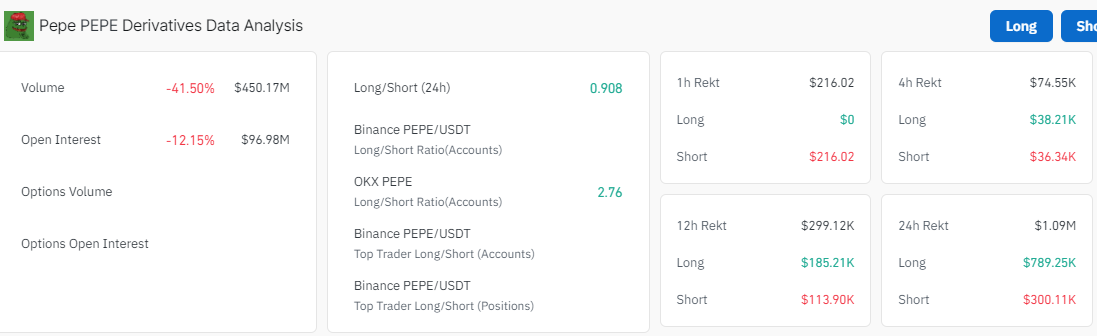
Pepe is the third-largest meme coin on Ethereum by holder count and is up a whopping 608% in a year, gaining a spot among the fastest-growing meme coins in the crypto sector. According to data from Coinglass, the memecoin is having difficulty convincing traders that it is a good call. This is because the short positions are comparably higher than the long positions. This suggests that traders are shorting PEPE.
Advertisement

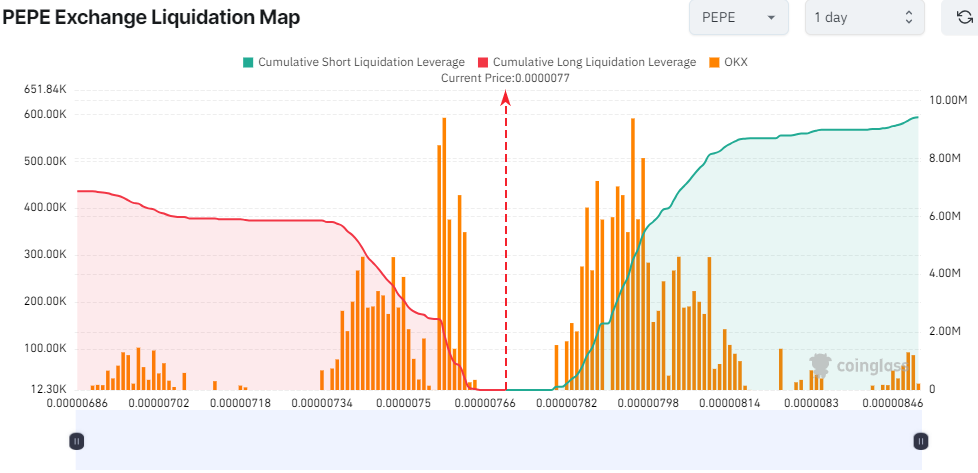
Notably, the Open Interest (OI) has dropped by 12.15%, and its volume has fallen by 41.50%. When both OI and volume decrease, it signifies that long positions are closing, potentially resulting in a loss. When long positions close, traders tend to open short positions, which can be a bearish indicator of the Pepe price.
On the other hand, Max, a CEO and founder at Because BTC, disagreed with PEPE losing its market structure and the bearish prospects surrounding the coin. He has noted that “The only pair that matters for PEPE more than the USD valuation is the ETH valuation. Regardless of how much we love PEPE as a meme, it is a prisoner to its L1, just like everything else.”
I see a lot of people commenting that Pepe/USD has lost its market structure & is now bearish. I completely disagree & here is why…
The only pair that matters for $Pepe more than the USD valuation is the $ETH valuation. Regardless of how much we love $Pepe as a meme, it is a… pic.twitter.com/LALMTywCMt
— Max (@MaxBecauseBTC) August 20, 2024
Pepe Statistical Data
Based on CoinmarketCap data:
- PEPE price now – $0.000007707
- PEPE market cap – $3.24 billion
- PEPE total supply – 420.69 trillion
- PEPE circulating supply – 420.69 trillion
- PEPE ranking – #25
PEPE Technical Indicators Emerge Bearish
The frog-themed memecoin attempted a recovery on August 20, as it surged 14% during the brief market recovery. Following this uptrend, PEPE briefly pulled back to a support zone, where it appears poised to rebound. Currently, the PEPE price struggles as the bulls succumb to the selling pressure in the market.
To start with, the frog-themed memecoin trades below both the 50-day and 200-day Simple Moving Averages(SMAs). In this scenario, the bulls are encountering immediate resistance at $0.00000845 and $0.00000961, which coincides with the SMAs.
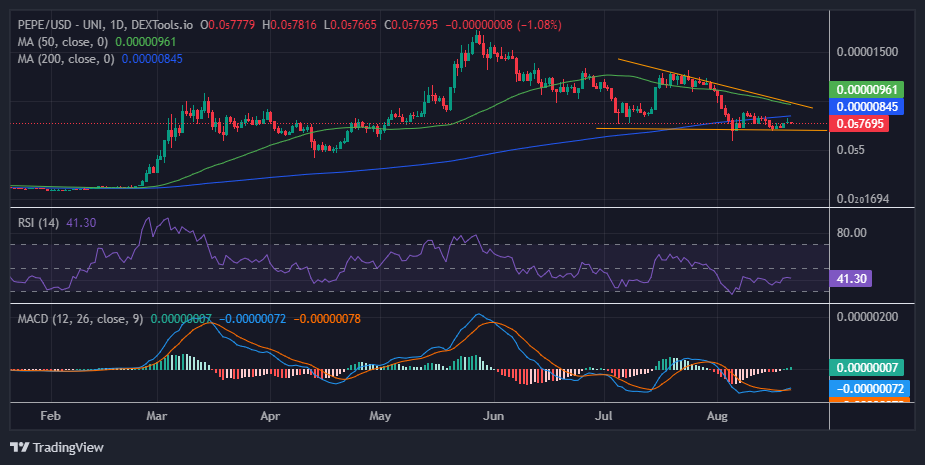
The RSI is at 41.30, indicating bearish conditions in the PEPE market. However, if the bulls gather momentum at this level, the RSI could jump above the 50-mean level. Furthermore, its position below 70 indicates significant room for the upside before PEPE is considered overbought.
Meanwhile, the Moving Average Convergence Divergence upholds a bullish outlook, calling traders to rally behind PEPE. Its position above the orange signal line suggests that the long-term moving average rises faster than the short-term moving average. Moreover, traders are inclined to buy more PEPE unless the MACD changes.
PEPE Price Prediction
In the daily chart analysis, the PEPE price is signaling bearish prospects, tilting the odds in favor of the sellers. However, if the Pepe coin price holds above the current support of $0.00000775, this could signal the start of a stronger uptrend, with the next target at 0.00000961.
Conversely, a breach and break below the support zone at $0.00000775 would see the price drop. If Pepe’s price fails to hold above 0.00000775, it might be prudent to exit and reassess, as this could indicate further downside or continued consolidation. This would see the frog-themed memecoin finding support lower at around $0.000005988
Advertisement


Emmaculate Araka
Emmaculate Araka is a cryptocurrency writer with published works on Crypto2Community and other news sources. She is believer in the transformative power of crypto and the blockchain industry, conducting on-chain analysis, breaking down market-triggering events, and helping traders and investors benefit from expert technical price analysis. Emmaculate finds gratification in diving deep into the crypto space, earning herself significant knowledge and experience. She holds a Bsc. in Information Science, and outside work, Emmaculate loves reading novels and watching documentaries.
View full profile ›ℹ️About Crypto2Community's Editorial Process
Crypto2Community's editorial policy is centered on delivering thoroughly researched, accurate, and unbiased content. We uphold strict editorial policy and sourcing standards, and each page undergoes diligent review by our team of top crypto industry experts and seasoned editors. This process ensures the integrity, relevance, and value of our content for our readers.