Pepe Price Soars Over 20% in a Week as PEPE Shows Signs of More Upside Potential

Cryptocurrency trading is speculative and your capital is at risk when you trade. We may earn affiliate commissions from some of the products on this page - at no extra cost to you.

Pepe (PEPE) price, a frog-themed memecoin, has surged 25% in a week despite slipping almost 1% today, with the token falling to $0.00001205 at the time of writing. Despite the decline, its trading volume has surged 31% to $832.86 million in the past 24 hours. This suggests intense rising activities among traders and investors in the PEPE market.
Moreover, Brian Garrett, founder and CEO of global entertainment brand Future Star, highlighted just a few of the whale PEPE token purchases over the weekend.
Advertisement

A lot of big $PEPE buys today and these are just within the past few hours 💰 pic.twitter.com/xYqdEGsqfQ
— Brian Garrett (@BrianGarrett) July 21, 2024
On the other hand, traders and investors are optimistic about a more upward trend in the PEPE price market. Aurther ETH, a crypto and blockchain enthusiast, has taken to the X platform, predicting his hope for the frog-themed memecoin.
Here's $PEPE a breakdown here, bit downs -3.61% dip today.
A bullish prediction ahead, as the market is recovering back.#PEPE #BTC pic.twitter.com/ggS8SWlT57
— Aurther ETH (@Aurther_Davis) July 22, 2024
However, Pepe’s price is positioned for more upside potential contingent on how the bulls play their cards in the market.
#PEPE in deep correction, resting on strong support💁♂️
Bulls defending $0.0777 level, forming a support🔺
Waiting for possible recovery if price breaks and holds above $0.0916👨💻
👇Crypto Traders-join Telegram👇 https://t.co/caOlZBzS3k
. pic.twitter.com/Ar1bbAG1er— Whales_Crypto_Trading 🐋 (@WHALES_CRYPTOx) July 22, 2024
Pepe Statistical Data
Based on Coinmarketcap data:
- PEPE price now – $0.00001205
- PEPE market cap – $5.07 billion
- PEPE total supply – 420.69 trillion
- PEPE circulating supply – 420.69 trillion
- PEPE ranking – #22
The Pepe price is trading with a bullish bias within the confines of a bullish flag. The token attempted to break above the flag over the weekend before it faced resistance at around $0.00001269. This forced the bulls to retrace slightly, as they found a strong support at $0.00001199. Moreover, the bulls are showing resilience, with the PEPE market signaling a potential upward move.
Technical Indicators Throw Mixed Reactions as the PEPE Market Hint At a Potential Upward
Based on the PEPE price technical outlook, there is a tug-of-war between the bulls and the bears as they try to gain control of the market. To start with, the token trades well above the 50-day and 200-day Simple Moving Averages(SMAs). In this scenario, the $0.00001153 and $0.00001076, which coincide with the aforementioned SMAs, act as immediate support keys.
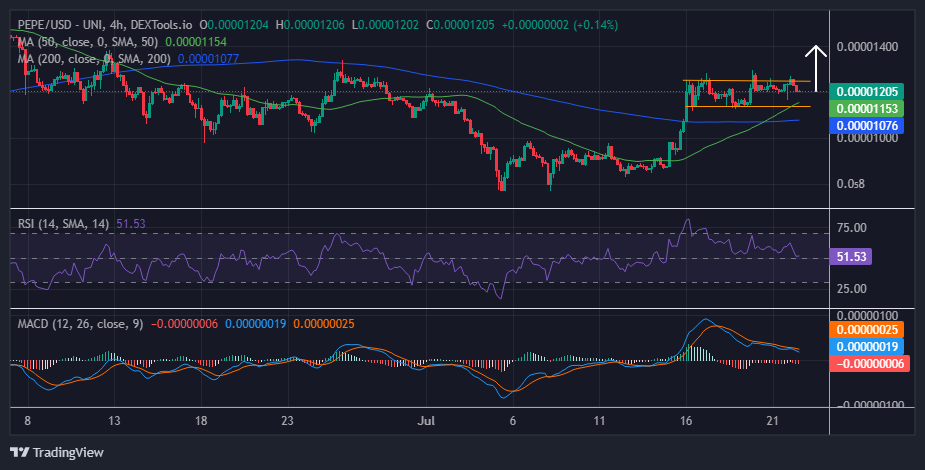
Moreover, the Relative Strength Index (RSI) has its strength at 51, above the 50-mean level. This suggests that the bulls are leading the PEPE market. However, if the bulls show momentum, the indicator might hurtle towards the north (70-overbought) zone, intensifying the buying pressure.
Meanwhile, the Moving Average Convergence Divergence (MACD) is showing bearish signals, with the MACD signal(blue) crossing below the signal line (orange band). This outlook shifts the momentum from bullish to bearish, suggesting that selling pressure exceeds buyer momentum. However, with the momentum indicator still in the positive region, all hope is not lost, as the bulls might flip bullishly, reinforcing the upward outlook.
Will the Bulls Hit the $0.000014 Mark?
In the 4-hour chart timeframe, the Pepe market is exhibiting mixed reactions. However, the odds are stacked in favor of the buyers, as the bullish technical indicators support the outlook. If the bulls increase their buying appetite, there is more room for upward movement. If they capitalize on the RSI and the MACD, the PEPE price could beat the $0.00001263 resistance, hurtling towards $0.000014 in the coming days.
Conversely, if the sellers step in and the PEPE market turns negative, the token might slump below the 50-day SMA. The bullish outlook will be invalidated in such a case, as the price could potentially retest the $0.00001077 level.
Advertisement


