Pepe Price Soars 93% in a Week Following Coinbase and Robinhood Listings

Cryptocurrency trading is speculative and your capital is at risk when you trade. We may earn affiliate commissions from some of the products on this page - at no extra cost to you.

Highlights:
- Pepe Price soars 93% in a week to trade at $0.000021, despite a fall in trading volume.
- Pepe has recently hit the headlines following listings on major exchanges like Coinbase and Robinhood.
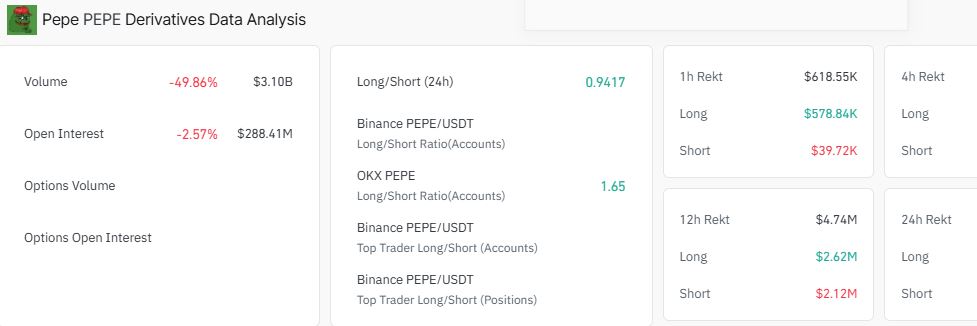
- Coinglass data shows dwindling open interest and volume in the Pepe market, suggesting that the traders may be closing their positions.
The Pepe price is in focus today as it has surged 0.39%, trading at $0.000021 on Nov 15. However, despite the slight surge, its daily trading volume has plummeted 53% to $10.32 billion, showing a recent fall in trading activities. Pepe is now up 93% in a week, 103% in a month, and 1673% in a year.
Advertisement

Recently, the frog-themed meme token(PEPE) has been making waves again, with a sharp price increase hitting an all-time high at $0.000025. This comes after Pepe obtained double listings from Coinbase and Robinhood on Nov 13, creating an immediate frenzy that caused a rally in the meme coin.
— Coinbase 🛡️ (@coinbase) November 13, 2024
However, recent indications hint that the digital asset’s explosive growth is cooling off, which may lead to slight pullbacks in the market. Coinglass data shows dwindling open interest and volume in the Pepe market, suggesting that the traders may be closing their positions and the current trend may weaken.
Pepe Statistical Data
Based on CoinmarketCap data:
- PEPE price now – $0.00021
- Trading volume (24h) – $10.32 billion
- Market cap – $9.08 billion
- Total supply – 420.69 trillion
- Circulating supply – 420.69 trillion
- PEPE ranking – #15
Pepe Price Hits ATH as Bulls Entirely Take the Reigns
The Pepe meme coin has recently made headlines with its remarkable price surge, following listings on major exchanges like Coinbase and Robinhood. On November 13, the meme coin experienced a staggering increase of nearly 50%, reaching new all-time highs and drawing significant attention from investors and analysts alike.
The frog-themed meme coin shows no signs of slowing down in its daily chart timeframe, as it paints the market as bullish. Currently trading around $0.000021, it’s challenging key resistance levels and has even hit a new all-time high at $0.00002567.
Meanwhile, a Golden Cross is in the market, positioning Pepe in a long-term bullish outlook. Further, the bulls have flipped the $0.0000102 and $0.0000106 into immediate support levels, steadying the upward momentum in the market.
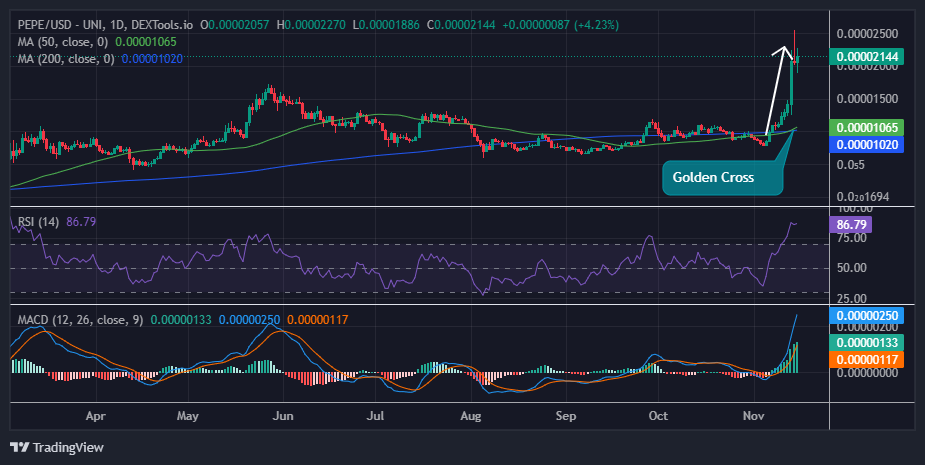
Technical Indicators Suggest a Slight Pullback
Despite the bullish outlook, traders should be cautious of a potential pullback as profiteering may begin. Investors who bought Pepe in the lower levels may want to book profits if the uptrend weakens and a correction begins.
This is evident after the RSI climbed from support at the mid-line (50) into the overbought area at 86.79 level strength. Traders won’t have to worry about sudden pullbacks with the RSI above 70, as this position also means a correction is imminent.
The Moving Average Convergence Divergence (MACD) indicator upholds the bullish picture, with a buy signal pulling away from the sell signal. This call to traders to consider buying PEPE manifested with the MACD line in blue, crossing above the orange signal line. As the momentum indicator gradually ascends above the mean line (0.00) into the positive region, the path with the least resistance stays on the upside.
Pepe’s price is winning on the daily chart timeframe, painting the whole market bullish. However, with the market overbought, it is prudent for traders and investors to watch out for a slight retracement. This will enable the Pepe bulls to sweep through enough liquidity before resuming a solid leg up.
A slight pullback may occur in such a case, causing the Pepe price to fall. However, the $0.000019 support area will cushion against further downside. Meanwhile, if the bulls persist with their buying appetite, the frog-themed meme coin could reclaim the $0.000025 mark.
Advertisement


