Notcoin Price Plunges 4% Following Rising Competition and Developer Strategy Shift

Cryptocurrency trading is speculative and your capital is at risk when you trade. We may earn affiliate commissions from some of the products on this page - at no extra cost to you.

Over the last 24 hours, the price of NotCoin (NOT) has dropped by 4% to trade at $0.014. Trading volume also decreased by 5% to $291 million during this timeframe. The price of Notcoin remains stagnant in a bearish market, and concerns grow over the increased competition in the tap-to-earn sector. Similarly, the futures market for Notcoin shows a decrease in open interest.
CoinGlass data reveals that open interest reached over $282 million on June 7 but decreased to $159 million. Major players contributing to this open interest include Binance, OKX, and Bitget.
Advertisement

Notcoin Explore is about to become a public platform for web3 projects worldwide
What projects do you want to see there more?
— Notcoin Ø (@thenotcoin) June 28, 2024
The token has pulled back as the developers consider strategies to enhance its ecosystem growth. In a recent X post, they sought input from the community on the next projects to integrate into the network. The options presented were Telegram games and memes, Web3 tools, and education and community initiatives.
Notcoin Price Statistics
- Notcoin price: $0.0145
- Market Cap: $1.43Billion
- Trading Volume: $277.31Million
- Circulating Supply:102.49Billion
- Total Supply: 102.49Billion
Not Price Bulls Gear Up for a Bullish Momentum Striving Within the Bearish Channel
The price of Not has consistently fallen as buyers and sellers engage in a tug of war, creating a bearish channel pattern. Despite this, buyers have shown resilience by pushing the price up from the support level at $0.01524 towards the resistance of the upper trend line in the channel.
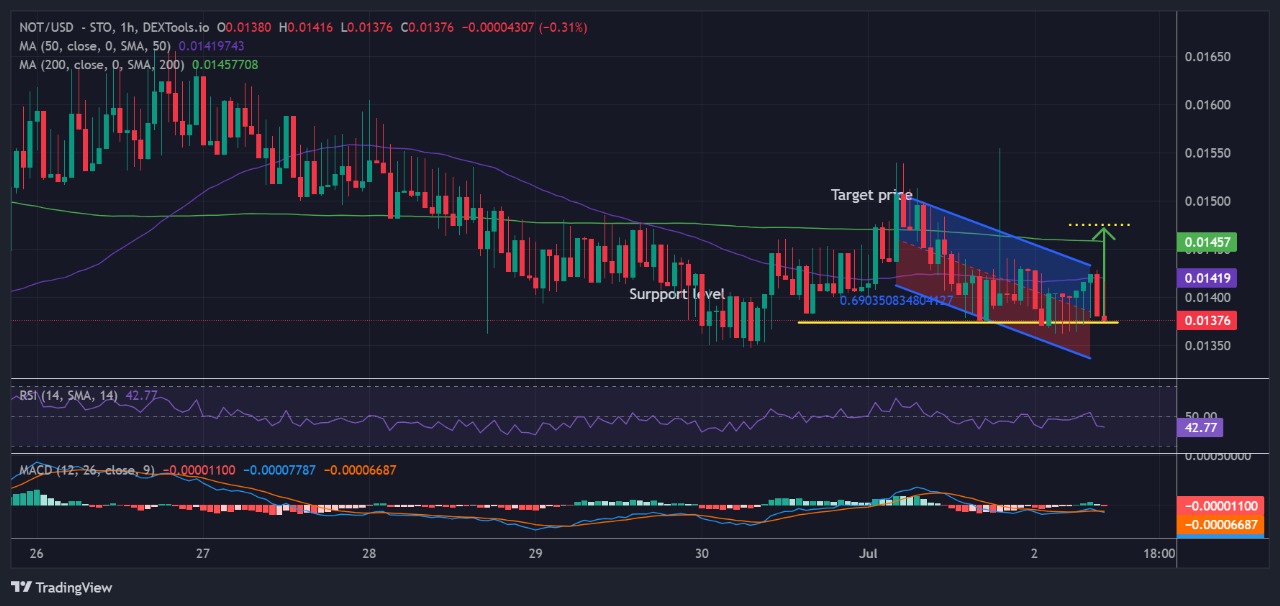
NOTUSD Analysis (Source: Dextools.io)
The market is showing strong signs of bullish momentum ahead. It’s currently on track to surpass its 50-day simple moving average (SMA), a positive signal indicating possible upward movement. This breakthrough could pave the way for a bullish crossover, offering hope for continued upward momentum.
Moreover, if the market manages to exceed the 200-day SMA, it could also mark a significant milestone, potentially leading to the formation of a new all-time high (ATH). This scenario suggests increasing investor confidence and a favorable outlook for future price appreciation.
The Relative Strength Index (RSI) further supports the bullish sentiment by indicating a surge above the midpoint level of 50. As it approaches the overbought threshold of 70, this upward trend in the RSI suggests growing strength in buying pressure. A sustained move towards the overbought region could potentially trigger a new ATH, reflecting strong investor demand and optimism in the market.
Additionally, the Moving Average Convergence Divergence (MACD) confirms the bullish outlook with its blue line crossing above the orange signal line. The MACD histogram bars, represented in green, are rising and increasing in size. This indicates a strengthening bullish momentum, reinforcing the likelihood of a bullish crossover and potential price appreciation in the near term.
Not Price Prediction
Despite the ongoing struggle between bullish and bearish forces, the bulls have shown strength by pushing the price upwards toward the upper trend line. Their goal is to achieve a target price of $0.01520, which would signal a favorable scenario for buyers and indicate potential further gains.
However, if the bullish momentum falters, the price might decline to $0.01315. This scenario would favor sellers in the market, potentially leading to increased selling pressure and a downward trend.
Read More
- 5 Altcoins With the Most Potential in July 2024
- Coinbase Seeks Appeal in SEC Case, Citing Binance Ruling
- Best Meme Coins to Watch Closely in July 2024
- DePIN Crypto Projects to Watch In 2024 – Top 10 DePIN Coins
- Best Metaverse Coins to Invest – Next Metaverse Coins

Advertisement


