Notcoin Price Outlook: NOT Could Rally to $0.016 as Bulls Target Critical Resistance

Cryptocurrency trading is speculative and your capital is at risk when you trade. We may earn affiliate commissions from some of the products on this page - at no extra cost to you.

The Notcoin price has flipped bullishly, surging 2%, with the NOT/USD trading at $0.0108 in the past 24 hours. Notably, its 24-hour trading volume has gone ballistic, surging 35% to $146 million, suggesting intense market activity.
The Telegram-based cryptocurrency might soon explode if money continues to flow into the token. Notcoin delicately holds $0.0108 support, hinting at a strong leg up if there is enough liquidity to resume the uptrend. An attempt to break above $0.0118 was rejected on August 19 under the 200-day Simple Moving Averages (SMA) resistance.
Advertisement

On the brighter side, the Notcoin price is on the borderline of reinforcing its leg up, as the bulls are showing resilience and are ready for a breakout. Data from Coinglass shows that Notcoin’s Long/Short Ratio has hit an exact reading of 0.95, slightly below 1. This ratio is a barometer of investor expectations.
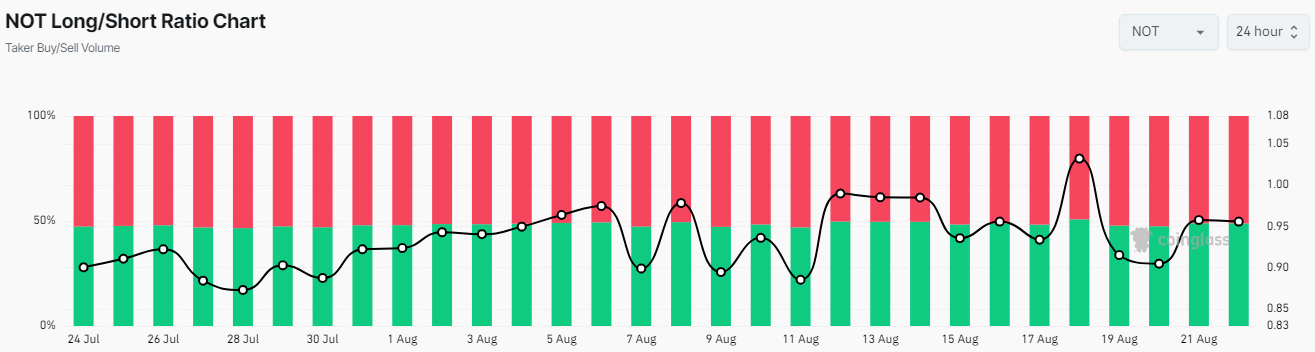
If the reading rises above 1, the average open position is bullish, while a reading below the value suggests a bearish stance. Therefore, the rising ratio reveals more long than short positions in the market.
Notcoin Statistical Data
Based on CoinmarketCap data:
- NOT price now – $0.0108
- NOT market cap – $1.11 billion
- NOT total supply – 102 billion
- NOT circulating supply – 102 million
- NOT ranking – #59
Currently, the Notcoin price shows bullish prospects, as it aims to break above the descending triangle. Notcoin price is at a critical juncture as bulls are poised to aggressively drive the price up by 20% to $0.014. However, if the support level of $0.0103 is breached, it could trigger another sell-off, potentially leading to a drop to $0.0093.
Bulls Aim for a Breakout Above the Descending Triangle
The technical indicators in the 4-hour chart timeframe show that the bulls are in control. The bulls have flipped the 50-day Simple Moving Average (SMA)(green) into support floor at $0.01082. This shows that the bulls are ready for an uptrend, as they target the next resistance at $0.0122, which coincides with the 200-day SMA.
Notably, the Relative Strength Index(RSI) is at 53, suggesting a bullish sentiment in the market. Moreover, increased buying appetite in the NOT token could see the RSI jump to the 70-overbought zone. Moreover, its position below the 70-overbought zone suggests more room for upside before NOT is considered overbought.
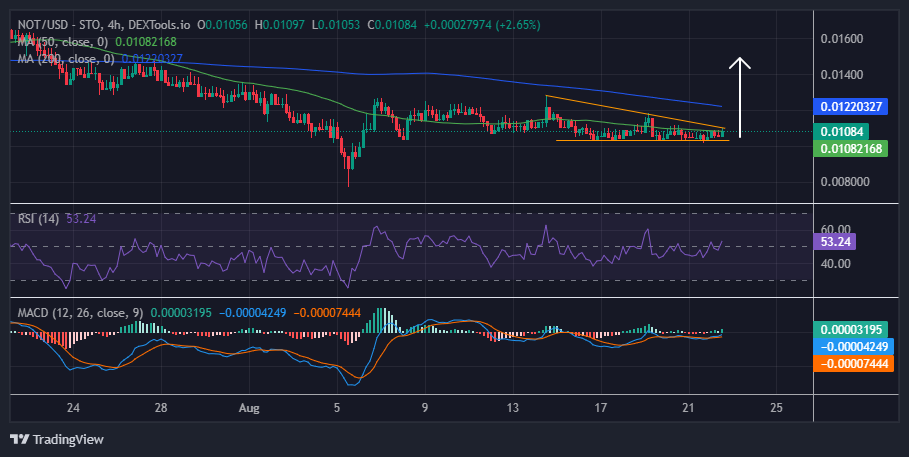
On the other hand, the Moving Average Convergence Divergence (MACD) calls for traders to rally behind NOT. Its position above the orange signal line suggests the bulls are in control and calls for traders to buy more NOT.
Notcoin Price Prediction
In the 4-hour chart analysis, the bulls are ready for an upswing, with the market signaling dwindling seller momentum. If the bulls initiate a buy-back campaign, with technical indicators like RSI and MACD calling for traders to buy, the NOT price could surge.
The anticipated rebound from $0.01082 will encourage traders to place buy orders betting on a significant leg up to $0.014. This move could trigger broader market FOMO, and NOT could rally to $0.016. Conversely, an extended retest at $0.0108 could enable selling pressure to build up as sellers gain confidence. Hence, another swing low to around the $0.0093 support area is possible before NOT reversing the trend.
Advertisement


