


Highlights:
- Memefi price rallies 254% to $0.0057, as the trading volume soars 1433%.
- The surge comes despite Binance’s delisting of the MEMEFI perpetual contract.
- Technical indicators show overbought conditions, signalling a short-term pullback soon.
The MemeFi price has skyrocketed 254% to $0.0057, as its daily trading volume spikes 1433% to $443 million. The aggressive bullish phase comes despite Binance delisting MEMEFI perpetual contracts.
Advertisement

This happened few minutes after binance “DELISTED” $MEMEFI
Could this be a SCAM-PUMP or what?
This same movement happened on $ALPACA, did Xs after it was delisted. pic.twitter.com/pae5jYiITO
— Green 🕊️ (@Degen_Green) August 7, 2025
Such a rapid price change has, however, sounded warning signs in the market. Most traders are wondering whether this increase in price is the start of another rug-pull. Within the 24 hours, Memefi has a total of over 4.85 million in liquidations, which is indicative of a very volatile market. Could this be a classic rug pump before the next exit?
Memefi Price Spikes Out in a Parabolic Curve
Extreme volatility is not indicated only by the rapid increase in the price of $MEMEFI. Based on the most recent information from the derivatives market, the volume of trading on the derivatives market impressively rose by 2387% to $2.19 billion. Moreover, the open interest in the derivatives market of the token has increased by more than 497% to $56.89 million. This increased activity in trading indicates a greater-than-normal rise in speculative activity.
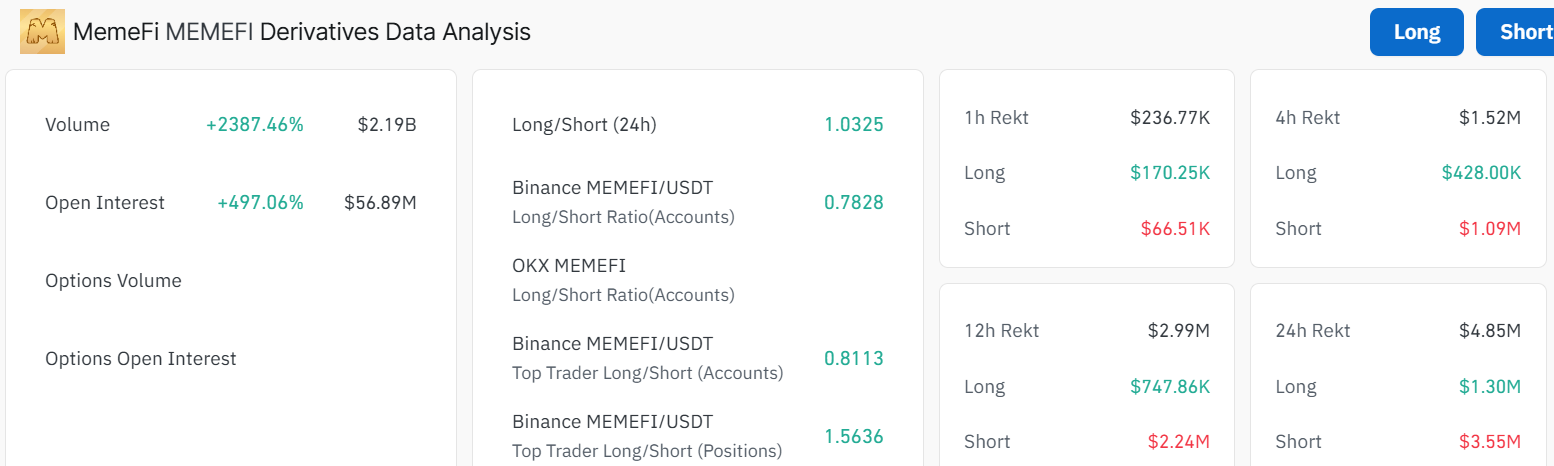
The data is also indicative of the long/short of $MEMEFI that shows a 24-hour ratio of 1.03. This suggests a fairly equal representation of selling and buying pressure. Nevertheless, the sharp increase in the number of long positions (0.81 ratio) at Binance and the intake of large volumes of liquidation are the arguments that lead to the doubtful sustainability of this rally. Moreover, it can be seen in the liquidation data that big-scale traders and investors are possibly in the crunch, considering the liquidation time of $1.52 million in 4 hours.
A quick look at the MEMEFI price 4-hour chart shows a parabolic rise. After a prolonged period of consolidation with minimal price movement, the asset erupted upwards, printing a series of higher highs and higher lows.
Meanwhile, the 50 Simple Moving Average (SMA) on the 4-hour timeframe currently stands at $0.0.0017, while the 200 SMA is at $0.0013. The current MemeFi price of $0.0057 is significantly above both of those key moving averages. This further confirms the bullish trend but also signals a strong momentum-driven breakout. The market indicators are also overserved as the Relative Strength Index (RSI) of $MEMEFI has touched a high of 96.16. This shows that the asset is highly overbought, and traders should be careful as a short-term pullback could be imminent.
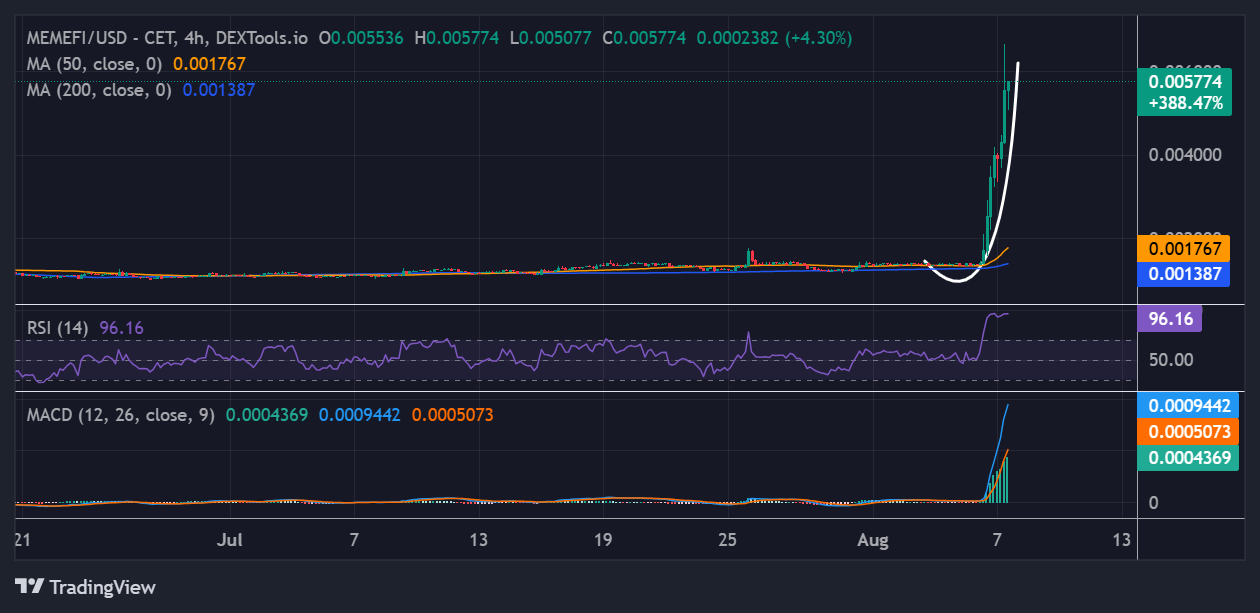
Further, the Moving Average Convergence Divergence (MACD) indicator has expressed a sharp spike, bolstering a bullish grip. The rise of two oscillators, such as the RSI and MACD, reflects that this rally may have an artificially pumped momentum that is fueled by hype and speculative buying and selling.
What’s Next for MemeFi?
The 254% pump indicates that Memefi price is gaining momentum and potential, but traders should tread carefully. With the RSI above 70-overbought territory, it might be time for traders to hit the sidelines and watch for a pullback. In the short term, the Memefi price could push to $0.006 within the next few days. However, with the overly overbought conditions, a slight retracement to $0.004-$0.003 could be imminent.
![]()
eToro Platform
Best Crypto Exchange
- Over 90 top cryptos to trade
- Regulated by top-tier entities
- User-friendly trading app
- 30+ million users
![]()
eToro is a multi-asset investment platform. The value of your investments may go up or down. Your capital is at risk. Don’t invest unless you’re prepared to lose all the money you invest. This is a high-risk investment, and you should not expect to be protected if something goes wrong.
Advertisement


