MANTRA Price Prediction: Is $2 Level Soon As OM Launches New Liquidity Pool on Base Chain?

Cryptocurrency trading is speculative and your capital is at risk when you trade. We may earn affiliate commissions from some of the products on this page - at no extra cost to you.

MANTRA (OM), a real-world asset (RWA) Layer 1 blockchain, has witnessed a robust rebound, with bullish pressure mounting on its price chart. The OM token currently trades at $0.8232, marking a significant increase of 4.46% during the European trading hour.
This surge in value is supported by a notable 5.711% increase in 24-hour trading volume, which now stands at $20,814,527. The price movement is steadily upward from an early low of $0.7782, suggesting renewed investor confidence and market momentum. The current market capitalization for OM has climbed to $683,766,743, ranking it 94th among cryptocurrencies.
MANTRA Price Prediction: OM Poised for Potential Growth
Over the past week, OM price has surged by 12%, trading in a range bound of $0.71 to $0.83. This significant increase reflects growing investor confidence and heightened market activity, driven by positive news and robust demand. However, the price fluctuations have been more volatile over the past month, with OM experiencing both sharp rises and sudden dips.
OM price has seen a dip of 10%, followed by a quick rebound. With the current surge in market activity and investor interest, OM is poised to potentially reach new highs. According to Defillama, MANTRA DAO (OM) has seen significant movement in its financial metrics. According to the latest data, the total value locked (TVL) in MANTRA DAO stands at $883,323.
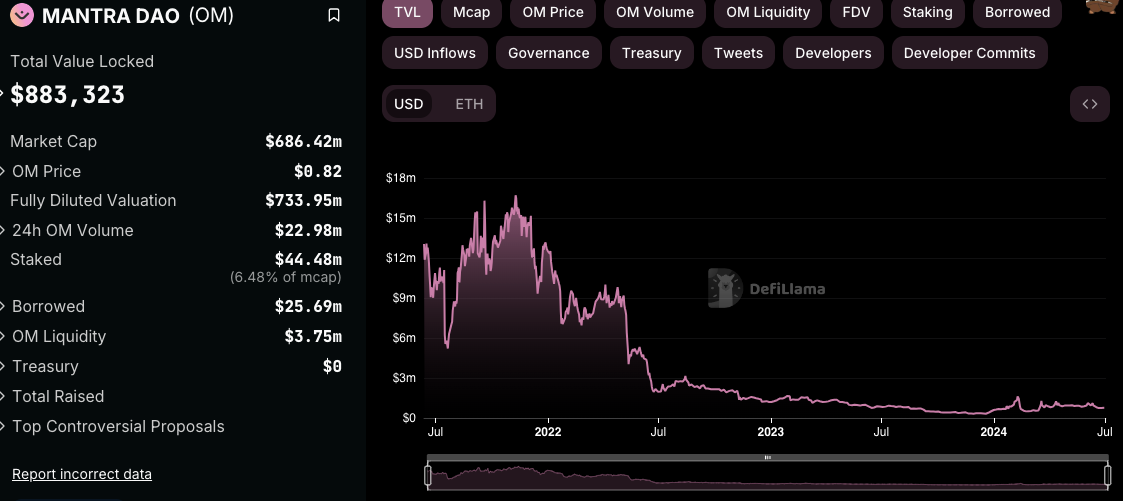
Furthermore, the Fully Diluted Valuation (FDV) of MANTRA DAO is around $733.95 million. Additionally, $44.48 million has been staked in the protocol, indicating a robust level of investor commitment and confidence in the long-term prospects of MANTRA.
MANTRA DAO Launches New Liquidity Pool on Base Chain
MANTRA, a decentralized autonomous organization, has officially launched a liquidity pool for its OM token on the Base Chain. The launch follows the approval of the DAO’s core proposal to establish the OM Uniswap liquidity pool, which aims to provide deep liquidity and allow users to perform OM swaps with minimal slippage seamlessly.
#MANTRA Launches $OM Liquidity Pool on Base Chain.
Our DAO core proposal to launch an $OM LP on @base was approved, and we’ve now created the first $OM Uniswap LP on Base Chain with deep liquidity, so users can seamlessly perform $OM swaps with minimal slippage.
✅ In addition,… pic.twitter.com/DHI63JzrcR
— MANTRA – Tokenizing RWAs (@MANTRA_Chain) July 2, 2024
The initiative introduces the first OM Uniswap LP on the Base Chain, enhancing the token’s utility and facilitating easier transactions within the network. Additionally, Base Chain users can now bridge $OM with BASE, further integrating MANTRA’s offerings into the Base ecosystem and providing users with early access to future products.
Indicators Suggest Strong Bullish Momentum for OM
The cryptocurrency has recently approached a critical resistance level of $0.83. A successful breach of this threshold could signify a return to bullish momentum, potentially elevating the coin’s value to $1. If MANTRA can maintain stability around this price, it might set its sights on the $2 mark, indicating a robust upward trajectory.
Conversely, a shift in market dynamics could see MANTRA retracting to the support level of $0.82. If selling pressure persists, the price may further decline to $0.80. Such movements suggest a bearish trend, potentially influencing the market’s short-term outlook.
The technical indicators on the MANTRA chart reveal intriguing dynamics in the crypto market. The Relative Strength Index (RSI) is currently at 68, hovering above the middle of its range, which suggests that the asset is neither overbought nor oversold.
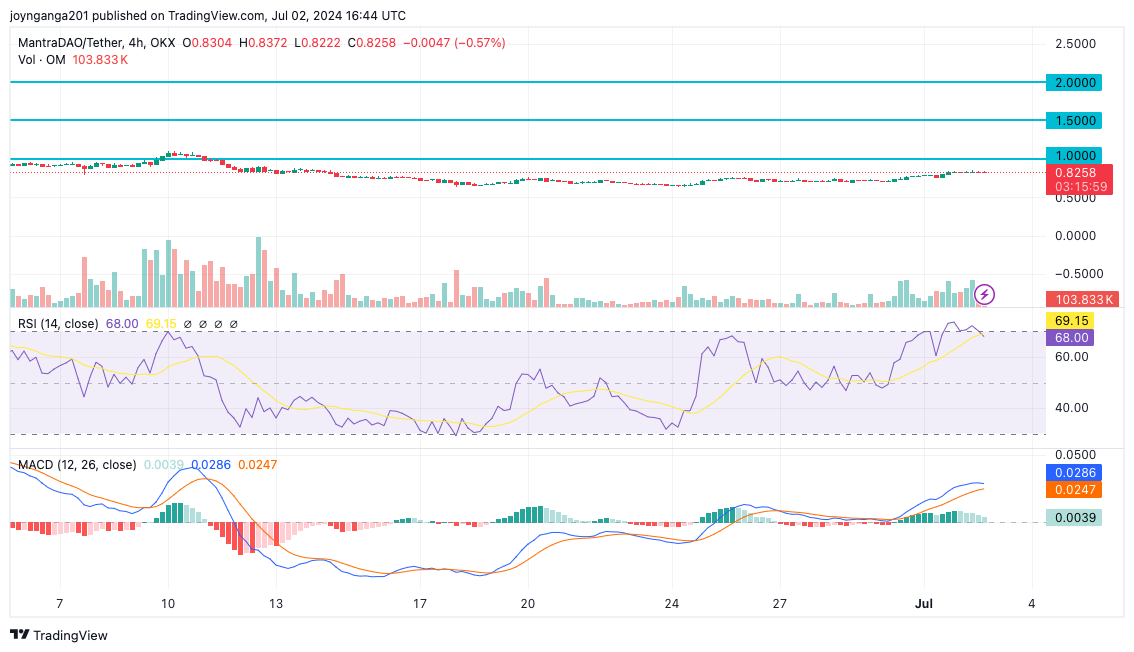
The Moving Average Convergence Divergence (MACD) shows a slight convergence between its signal lines. The MACD line has risen slightly above the signal line, which suggests a potential upward momentum.
Read More
- Robinhood Expands Trading Services to Three New US Regions, Considers Offering Crypto Futures
- DePIN Crypto Projects to Watch In 2024 – Top 10 DePIN Coins
- Best Metaverse Coins to Invest – Next Metaverse Coins


