MAD Price Surges 98%, Gaining Momentum with Strong Investor Interest

Cryptocurrency trading is speculative and your capital is at risk when you trade. We may earn affiliate commissions from some of the products on this page - at no extra cost to you.

Highlights:
- Mad ($MAD) surged 98% in 24 hours to $0.00005952, with trading volume up 140% to $21 million.
- PS Trade notes a 30–40% price movement for $MAD may have found a local bottom after its rally.
- With a $72 million market cap and listings on OKX, FUN, and MEXC, $MAD is gaining momentum.

MAD Statistics
- MAD price: $0.00005952
- Market capitalization:$72 million
- Trading volume: $21.5 million
- Circulating supply:999 billion
- Total supply:999 billion
Mad Price Parabolic Surge Shows Strong Bullish Momentum
The MAD/USD trading pair displays strong bullish momentum, currently trading at $0.00006869, reflecting a 17.40% increase over the past 24 hours. The price has broken significantly above the 50-day moving average (SMA) at $0.00003578 and the 200-day MA at $0.00001720, confirming bullish trends in both the short and long term. The moving averages indicate solid upward momentum, suggesting buyers are firmly in control.
The support zone between $0.00002000 and $0.00003500 was a strong base during the previous consolidation phase. This zone is critical for sustaining the uptrend, as it represents a level where buying interest has historically strengthened. The price has also followed a parabolic curve, signaling accelerating momentum fueled by robust buying pressure.
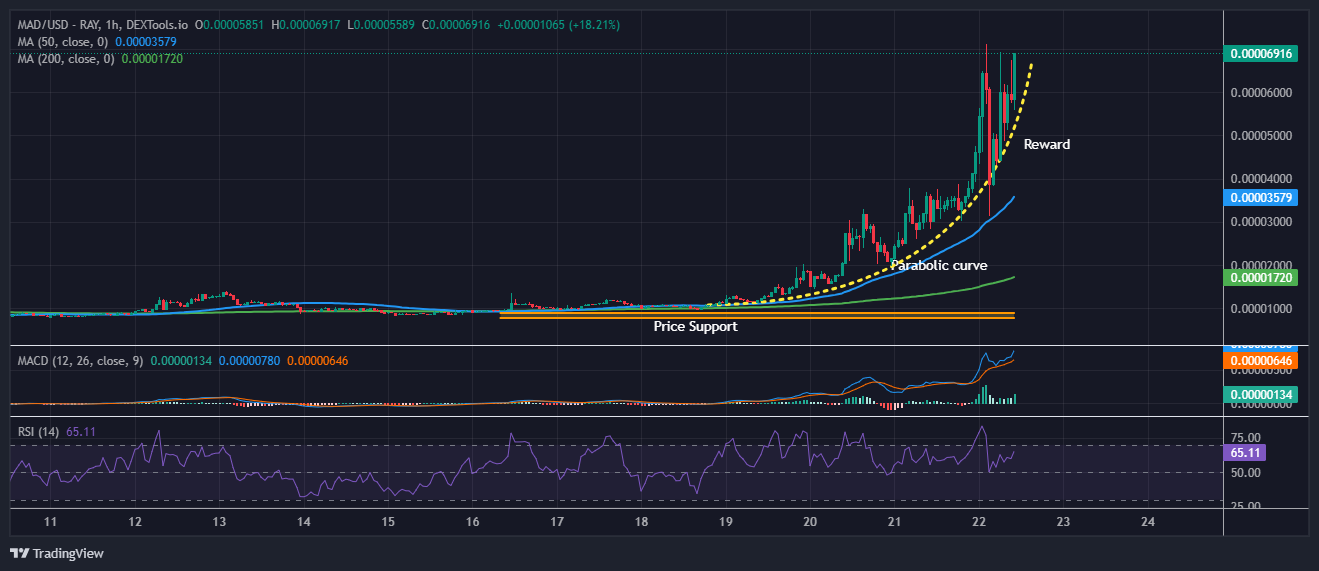
Technical indicators further reinforce the bullish sentiment. The MACD (Moving Average Convergence Divergence) is strongly positive, with the MACD line (0.0000131) above the signal line (0.00000776) and expanding histogram bars, signaling increasing bullish momentum. However, traders should watch for any divergence or slowing in the MACD histogram, which could hint at a potential reversal or weakening trend.
The Relative Strength Index (RSI) stands at 64.91, approaching the overbought zone but still below the threshold of 70. This indicates that the rally still has room to run before significant selling pressure emerges. If the price continues along the parabolic curve, the next resistance zones to watch are $0.00007500–$0.00008000, with further upside potential toward $0.00010000 if buying momentum persists.
However, a pullback is possible, given the steep nature of the rally. In such a scenario, key support levels include $0.00005000 (psychological support), $0.00003578 (50-day MA), and the broader support zone at $0.00003500.
Advertisement


