Mad Price Skyrockets 77% as Bullish Momentum Builds – How High Can MAD Go?

Cryptocurrency trading is speculative and your capital is at risk when you trade. We may earn affiliate commissions from some of the products on this page - at no extra cost to you.

Highlights:
- Mad price soars 77% to trade at $0.000045 despite a slight plunge in daily trading volume.
- Crypto enthusiasts mention that the targets for MAD are exponentially higher than one may think.
- With a market cap of $45.33 million and a growing community of over 43.83k holders, $MAD is steadily gaining momentum.
The MAD price is winning on the charts today, as it has jumped 77% to trade at $0.000045 at press time. Despite the surge, its daily trading volume has plunged 8% to $8.27 million, suggesting a fall in market activity. However, the spike in its market cap by 77% to $45.33 million signals that is gaining traction and catching investors’ and traders’ eyes alike.
Advertisement

Elsewhere, @Max_Minters, a crypto enthusiast, has stipulated that the targets for MAD are exponentially higher than one may think. This is because Mad has one of the best distributions, an increasing holder count, and so much space to increase.
Stats for $MAD is mental. Its got one if the best distribution, increasing holder count and so much space to increase.
Targets are exponentially higher then one may think. I reentered my position around 35mil.
Thinking of holding it for months now @madcoinvip you guys keep… pic.twitter.com/ecrMgbwHOu
— MaxMinter (WIF the 🧢, POP the 🐈) (@Max_Minters) November 25, 2024
With a market cap of $45.33 million and a growing community of over 43.83k holders, $MAD is steadily gaining momentum. Further, its listing on major platforms such as OKX, FUN, and MEXC has also made it highly accessible to a broader audience, enhancing its appeal and driving adoption.
Mad Statistical Data
Based on CoinmarketCap data:
- MAD price now – $0.000045
- Trading volume (24h) – $8.27 million
- Market cap – $45.33 million
- Total supply – 999.98 billion
- Circulating supply – 999.98 billion
- MAD ranking – #684
Mad Price Rebounds Within a V-Bottom Pattern
The MAD/USD trading pair displays solid bullish momentum. It is trading at $0.00004599, reflecting a 77% increase over the past 24 hours. After reaching a high of $0.000077 on Nov 22, the meme coin started dwindling as the bulls gathered momentum at the $0.0.000022 mark, cushioning against further downside. The Mad price has broken out, rebounding to $0.000045 at press time, forming a V-bottom pattern.
The price has broken significantly above the 50-day moving average (SMA) at $0.000029 and the 200-day MA at $0.000014, confirming bullish short- and long-term trends. The moving averages indicate solid upward momentum, suggesting buyers are firmly in control. Meanwhile, increased buying appetite at this level could cause the MAD price to reclaim the $0.000077 high in the short term.
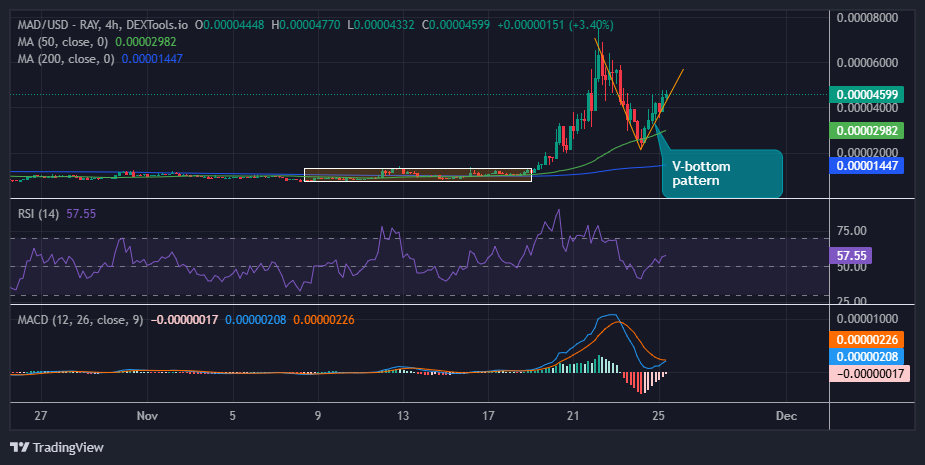
Moreover, the RSI has rebounded above the 50-mean level at 57.55. Its position above the mean level indicates intense buying pressure, which could soon cause the RSI to jump into the 70-overbought zone.
The MACD indicator is notably on the verge of making a bullish crossover. This will only manifest if the MACD line in blue crosses above the signal line in range, calling for traders to rally behind MAD. In the meantime, until that crossover takes place, traders are inclined to hold their positions in MAD intact.
MAD Price Could Rally Reclaiming Its ATH
The MAD bulls could rally the token’s price and reclaim its ATH soon. If the bulls capitalize on the rising RSI and the support levels stay intact, the buyers could reach the $0.000077 mark. In a highly bullish case, the meme coin could reach $0.0001.
On the downside, if the bears step in and the market turns negative, the MAD price could plunge. In such a case, the $0.000029 support level would be in line to absorb the potential selling pressure.
Advertisement


