Mad ($MAD) Makes a Comeback with $27.7 Million Market Cap and Growing Buzz

Cryptocurrency trading is speculative and your capital is at risk when you trade. We may earn affiliate commissions from some of the products on this page - at no extra cost to you.

Highlights:
- Mad price has soared 89% in the last 24 hours to trade at $0.00002754
- The token now has over 20,563 active holders.
- $MAD is listed on major platforms like OKX, FUN, and MEXC.
The Mad ($MAD) price has soared 89% in the last 24 hours to trade at $0.00002754 as of 5 a.m. EST on a 548% pump in trading volume to $8.58 million. Mad meme coin is making a bold return, reemerging from a previous hype cycle with renewed vigor and aligning perfectly with current crypto trends. Positioned as a strong contender for the spotlight, $MAD is rekindling interest among investors and traders alike.
Advertisement

A memecoin from the previous hype cycle that aligns perfectly with today’s trends, making it a strong contender for renewed attention.
1. MC: $13.7M
2. Holders: 20,563
3. CA: madHpjRn6bd8t78Rsy7NuSuNwWa2HU8ByPobZprHbHv pic.twitter.com/WXK8eJCM3O— SWIPER (@0x_Swiper) November 19, 2024
With a market cap of $27.07 million and a growing community of over 20,563 holders, $MAD is steadily gaining momentum. Its availability across multiple prominent platforms, such as OKX, FUN, and MEXC, ensures easy accessibility for a wide audience, further boosting its appeal.
What sets $MAD apart is its ability to bridge nostalgia with modern relevance. As the market evolves, $MAD is proving it has the potential to capture the imagination of those seeking both familiarity and innovation in their investments.
This token’s resurgence is one to watch as it positions itself for another round of market attention. Whether $MAD reclaims its former glory or carves out a new niche, it’s clear that it’s ready to make waves once again.
MAD Statistics
- MAD price: $0.00002754
- Market capitalization:$27.07 million
- Trading volume: $8.58 million
- Circulating supply:999 billion
- Total supply:999 billion
Mad Price Parabolic Surge Shows Strong Bullish Momentum
The MAD token went on an impressive ride within the past few days. From a very low $0.000001100, the price shot to 0.000002688, a rapid rise of 2.6%. This steep movement up was thus pinned on a robust price support level at $0.000001145, assisting the token to keep its bullish momentum and act as a ground for support for further development.
Most striking, though, is the parabolic curve the price is following. This pattern is common in explosive rallies and shows how the token is attracting major demand to push it to new heights. It signals that the MAD token has entered a high-growth phase, with investors likely attracted due to news or changing sentiment.
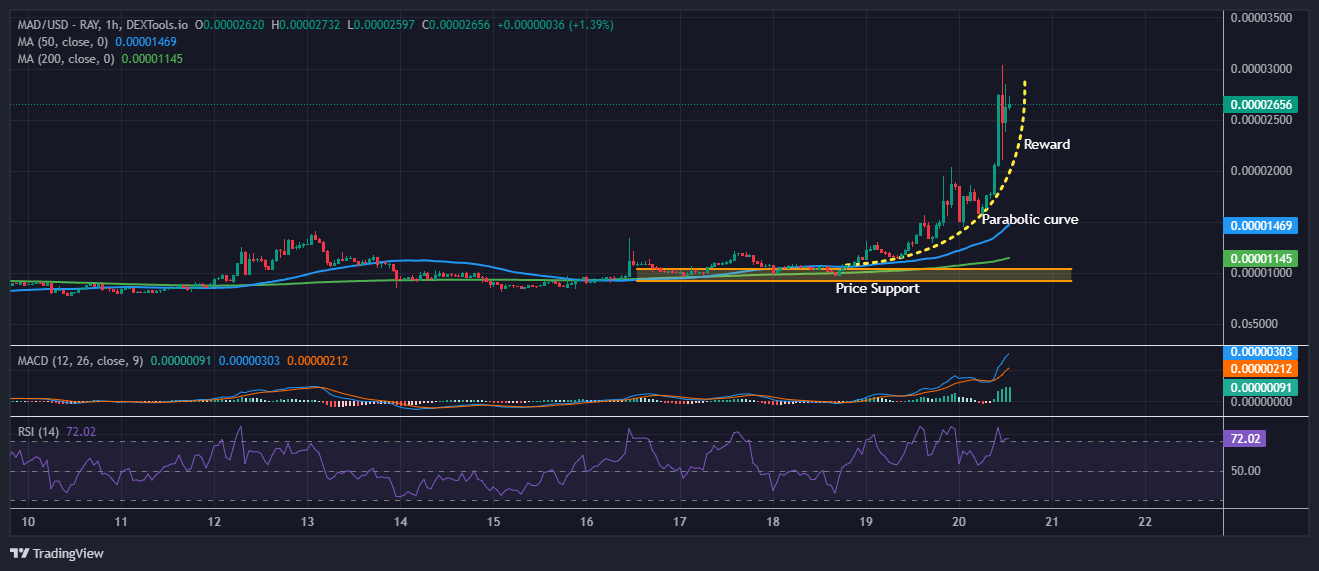
The 50-period SMA is increasing and continues to confirm that the trend has become short-term bullish. It’s crossed above the 200-period MA, an incredibly powerful signal that the token could continue higher. Even the 200-period MA, which was lower, now starts to rise, indicating that the token’s long-term trend could also be turning in its favor.
RSI Signals Possible Pullback
However, the RSI tells a somewhat different tale. While currently at 72.46, the RSI has entered the overbought territory, indicating that the token might be overheating and is in for a pullback or consolidation soon enough. In a parabolic move like this, though, high RSI levels usually accompany continued momentum; thus, it could stay up high for some time.
The MACD confirms the strength indication, with the green line above the red line signaling upward momentum. Additionally, the histogram is expanding, indicating increased buying pressure. However, the divergence between the two MACD lines is starting to narrow, which might indicate that the rally could be softening in the near future.
Advertisement


