Litecoin Price Soars 3% Amid Surging Trading Volume – Analyst Highlights a 90%-100% Rally in the Medium Term

Cryptocurrency trading is speculative and your capital is at risk when you trade. We may earn affiliate commissions from some of the products on this page - at no extra cost to you.

Highlights:
- Litecoin’s price shows a bullish momentum, surging 3% in trade at the $88 mark.
- A crypto analyst has highlighted a potential 90-100% rally in the LTC market.
- LTC bullish technical indicators suggest further upside toward the $95 technical barrier in the short term.
The Litecoin price has bottomed out from the $69 April low, currently trading at $88.90. The LTC token has surged 3% in the past 24 hours, and the daily trading volume has increased 26% in the same period. This recent rise in volume shows that investor confidence has soared, as they bet on price increases in the Litecoin market.
Advertisement

The bullish momentum radiates all through the LTC market, as it has pumped about 4% in the past week, showing rising bullish sentiment. Moreover, a well-known analyst, Globe of Crypto, has said via X that Litecoin has broken out of the descending channel and is currently retesting on the daily chart. He added that a successful retest can provide a 90%-100% bullish rally in the mid-term.
$LTC
Broken Descending Channel and currently Retesting in Daily Chart.
Successful Retest can provide 90-100% Bullish Rally in Midterm ✍#Litcoin pic.twitter.com/OhpFlM5X9a— Globe Of Crypto (@GlobeOfcrypto1) May 2, 2025
Litecoin Price Outlook
A quick look at the LTC daily chart shows that the bulls have shown remarkable strength after flipping the $83 resistance, which aligns with the 50-day MA as support. If the support level holds and the buying intensity surges in the market, the Litecoin price could be poised for further upward movement.
The $95 immediate resistance key may be in trouble in such a case. A break above this level will call for a further bullish breakout towards the $100 and $103 resistance marks. Meanwhile, for the bullish sentiment to be validated in the market, the LTC bulls must push through the $103 mark, flipping the odds towards the bulls.
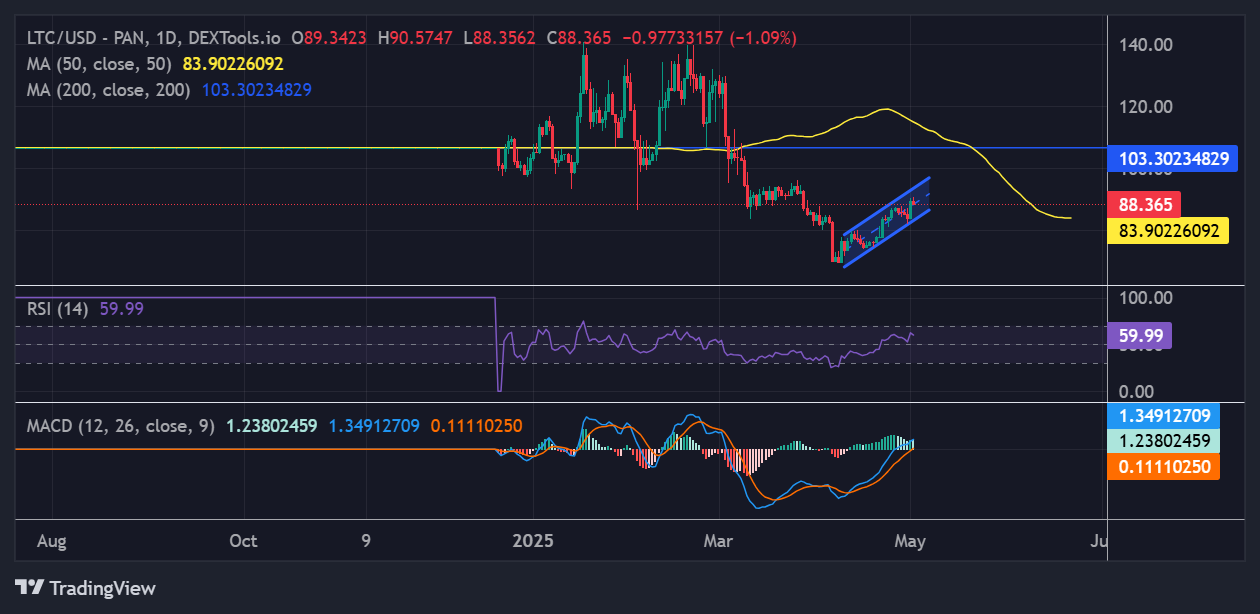
A closer look at the LTC Relative Strength Index sits at 59.99, signaling a growing buying appetite. This confirms a bullish picture in the LTC market, as a climb towards the 65 mark will indicate heightened buying pressure.
On the other side of the fence, the MACD (blue) momentum indicator confirmed a buy signal on April 11. This indicates a bullish sentiment, urging traders to keep buying Litecoin unless the blue MACD flips below the orange line. Additionally, the MACD’s movement above the neutral level, bolstered by the increasing green histograms, suggests a higher chance of a potential surge towards the $95 mark soon.
Conversely, traders should be cautious about possible downward movements. If investors seek early profits, the $83 support area will absorb the potential selling pressure. If this level gives way, it may slow the current upward trajectory, even leading to more downside in the Litecoin price. In such a scenario, the LTC token will retest the $81, $78, and $75 levels.
Litecoin Derivatives Data Analysis
According to CoinGlass data, the analysis of LTC derivatives shows some mixed signals. LTC’s open interest (OI) has dropped 0.55% to $511.05M despite surging volume by about $37% to $874.59M.
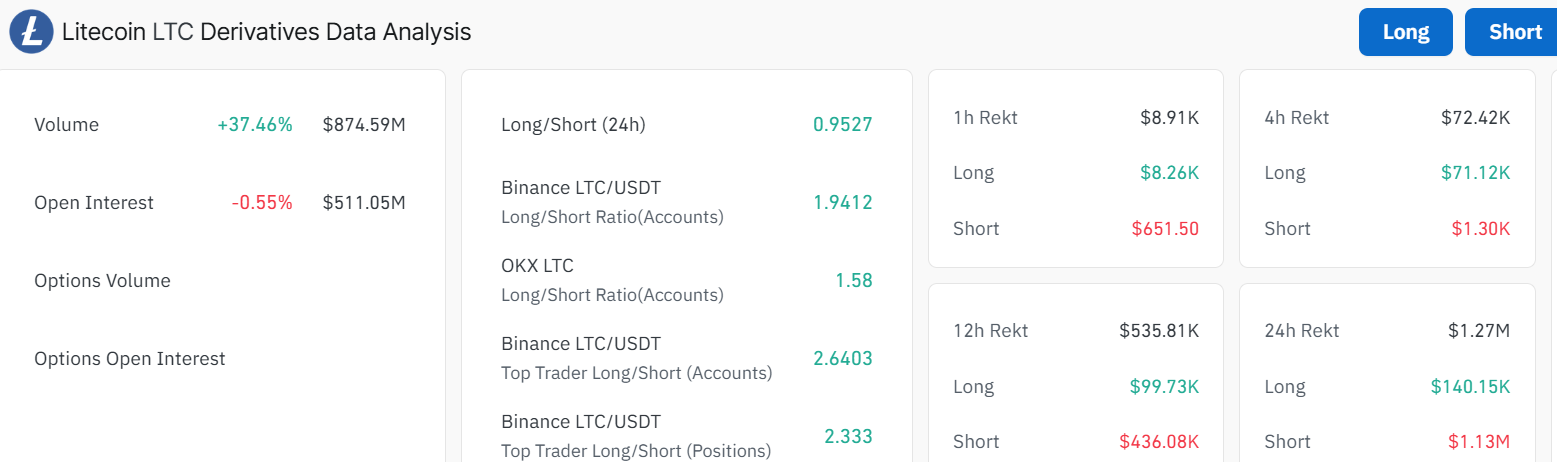
The rising volume shows that trading activities are soaring, with investors confident that Litecoin will increase its price. However, with the decreasing OI, the bullish traders are forcefully closing down their positions. This may cause a potential reversal or downward movement if the bulls lose stamina.
![]()
eToro Platform
Best Crypto Exchange
- Over 90 top cryptos to trade
- Regulated by top-tier entities
- User-friendly trading app
- 30+ million users
![]()
eToro is a multi-asset investment platform. The value of your investments may go up or down. Your capital is at risk. Don’t invest unless you’re prepared to lose all the money you invest. This is a high-risk investment, and you should not expect to be protected if something goes wrong.
Advertisement


