Kaspa Price Slightly Dips as Analyst Projects Bullish Target of $0.25

Cryptocurrency trading is speculative and your capital is at risk when you trade. We may earn affiliate commissions from some of the products on this page - at no extra cost to you.

The Kaspa (KAS) price has recently dipped by 0.2% to trade at $0.1644 as of 4:52 a.m. EST, with trading volume seeing a significant increase of 59%, reaching $55 million. This change has brought the market capitalization to $4.05 billion. Analyst Abraham Soilman has proposed a “50% increase strategy” for Kaspa, suggesting a bullish outlook based on recent price movements.
$kas 50% increase strategy
If price reaches next line after falling one step lower, it never touches lower line again. Moreover, rise isnt limited to one level, but price rises at least two lines. According to this strategy, first stop of the price is not 0.11 but 0.25usd #Kaspa pic.twitter.com/uwOdYJiDUlAdvertisement
— Abraham Soilman (@Psycholog_ist_) September 25, 2024

The strategy indicates that following a slight drop in price after reaching a specific level, Kaspa tends to maintain higher lows, reflecting strong upward momentum. A chart accompanying the analysis shows horizontal lines for key support and resistance levels, with blue arrows depicting anticipated price movement in a stair-step pattern.
Soilman’s projections, reinforced by Fibonacci retracement levels or targeted price points, indicate a primary price target of $0.25 for Kaspa, diverging from the previous lower target of $0.1. This analysis points to a positive trajectory for the asset, hinting at the potential for significant gains in the near future.
Kaspa is a proof-of-work cryptocurrency that uses the GHOSTDAG protocol, which sets it apart from traditional blockchains. Instead of having just one block at a time, Kaspa allows multiple blocks to exist simultaneously and organizes them in order through consensus. This design leads to faster block times and quicker transaction confirmations, with Kaspa currently producing one block per second and aiming for even higher speeds.
KAS Statistics
- Kaspa price: $0.1644
- Market Cap: $4.05 billion
- Trading volume: $55 million
- Circulating supply: 24 billion
- Total supply: 24 billion
Kaspa Price Could Face a Downturn Within the Pennant
Currently, the Kaspa price is struggling to maintain its position above the $0.1590 support level as the bulls struggle to reach a new high. The market shows how the bullish trend is struggling to maintain its momentum as the bulls keep striving to break free so as to form a bearish crossover.
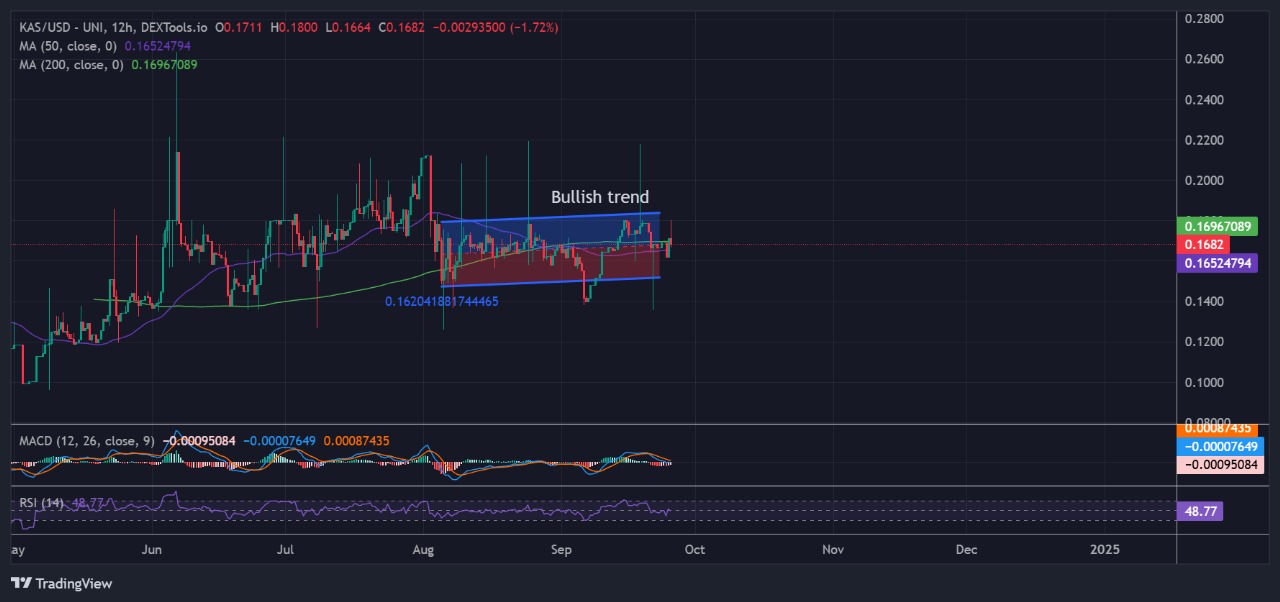
The price is trading above the 50-day and 200-day simple moving average (SMA), showing that more traders have been investing by buying. All of this is about to change since the 50-day SMA and the 200-day SMA are surging, aiming to surpass the market, decreasing the chances of the bulls continuing with their trend.
However, the relative strength index (RSI) shows resistance to continue to flow above the 50-midline level. This indicates a possibility of the Kaspa price lowering until crossing below the 50-midline level and maybe even lower. The RSI is currently flowing at 52, giving hope for bears to push the price low. The RSI might cross below the 50-midline level, aiming to reach the 30-oversold level.
Moving average convergence divergence (MACD) suggests an upcoming bearish trend since the rather one signal line is seen flowing above the blue line of MACD. On the other hand, the number of red histogram bars is increasing, supporting the likelihood of a bearish rally.
Despite the steady bull rally until reaching the ATH level, bears have been potentially gathering momentum to take over and push the price low to $0.1245. Additionally, if the price continues with its bullish momentum, the bulls will aim to raise the price to a target price of $0.1856, favoring buying investors.
Advertisement


