Jito Price Plunges 3% as Analyst Predicts a Perfect Opportunity to Accumulate JTO

Cryptocurrency trading is speculative and your capital is at risk when you trade. We may earn affiliate commissions from some of the products on this page - at no extra cost to you.

The Jito price is in focus today as it has plunged 3%, with the JTO/USD trading at $2.30. Despite the slight plunge, its 24-hour trading volume has surged 15% to $54 million, signalling intense market activity. Meanwhile, WHALES CRYPTOx has mentioned via the X platform that this is an excellent opportunity to accumulate JTO.
Advertisement
Price rebounded from ma 50 quickly to $2.64, and now showing consolidation🧐
Good opportunity to accumulate if you missed lower entries😏
Watching for resistances at: $3.81 and $5👨💻
👇Crypto Traders-join Telegram👇 https://t.co/caOlZBzS3k
. pic.twitter.com/Fz9Kq9pqT1— Whales_Crypto_Trading 🐋 (@WHALES_CRYPTOx) August 15, 2024

Jito Network is a significant contributor to the Solana ecosystem through its JitoSOL liquid staking pool and its collection of MEV products. The users can exchange their SOL for JitoSOL. In return, holders maintain SOL’s liquidity and DeFi opportunities while earning yield from staking. JitoSOL uniquely provides its holders with additional rewards from transaction revenue associated with MEV extraction on Solana.
Jito Price Statistical Data
Based on CoinmarketCap data:
- JTO price now – $2.30
- JTO market cap – $286 million
- JTO total supply – 1 billion
- JTO circulating supply – 124 million
- JTO ranking – #151
JTO Technical Outlook Flashes Bearish
The Jito price trades bearishly within the confines of a falling parallel channel. The token has been on a downtrend after it hit a resistance of $2.88 to the support zone of $2.25. Moreover, the technical indicators favour the downside, as the sellers dominate the market.
The Jito price trades below the 50-day and 200-day Simple Moving Averages (SMAs). In this case, the bulls must first deal with the $2.57 and $2.64 resistance keys before initiating a rally. The levels mentioned above act as immediate resistance keys in the Jito market.
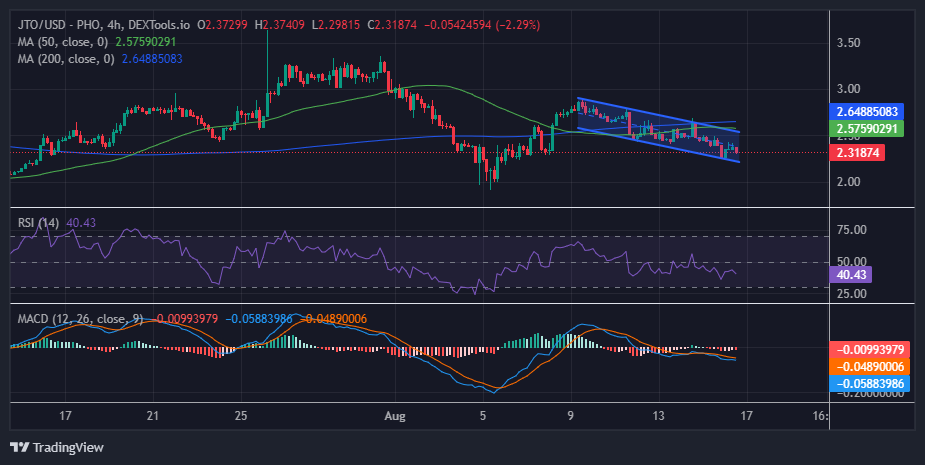
Moreover, the Relative Strength Index (RSI) suggests dwindling buyer momentum as it hovers below the 50-mean level. It currently sits at 40, indicating that the sellers have the upper hand in the JTO market. Moreover, if the bulls won’t enter the market at this level, the RSI could hurtle towards the 30-oversold zone. This would signal intense selling pressure, painting the market bearish.
On the other hand, the Moving Average Divergence (MACD) worsens the outlook, upholding the bearish outlook. The MACD indicator has crossed below the signal line in orange, tilting the odds towards the sellers. This suggests that traders and investors are inclined to sell JTO unless the MACD changes.
Jito Price Prediction
According to the 4-hour chart analysis in the Jito market, the big picture is bearish as sellers have the upper hand. Moreover, if the sellers capitalize on the 50-day and 200-day indicators, which show bearish prospects, the Jito price would drop further. Furthermore, the MACD indicator suggests a sell signal, which may cause the JTO price to dwindle. In such a case, if the sellers keep dominating the market, the JTO price would dive to the $2.25 support zone. In a highly bearish case, a breach and break below the support zone will see the price at $1.91, last recorded on 5 August.
On the flip side, if the bulls step into the market at this level, the Jito price could surge, coinciding with the 50-day SMA at $2.59. A flip of the $2.59 into the support floor will see the bulls surpass the next resistance at $2.64. This will see the price of Jito at $3 in a highly bullish scenario.
Advertisement


