JasmyCoin Shows Weakening Momentum Despite Correction Phase Completion

Cryptocurrency trading is speculative and your capital is at risk when you trade. We may earn affiliate commissions from some of the products on this page - at no extra cost to you.

JasmyCoin rises to $0.0285, showing weakening momentum with bearish daily signals despite a completed correction phase.
The price of JasmyCoin (JASMY) stands at $0.0285 today, with a 24-hour trading volume of $101,996,619.46. This represents a 0.58% increase in the past 24 hours but a 2.42% decline over the past seven days. With a circulating supply of 48 billion JASMY, the market cap of JasmyCoin is valued at $1,380,548,038.
Advertisement

Notably, JasmyCoin has underperformed the global cryptocurrency market, which has risen 4.40% in the past week, and similar Ethereum Ecosystem cryptocurrencies, which are up 12.70%.
Correction Completion and Impulsive Five Wave Rally
A chart analysis by Matthew Dixon, CEO of Evai.io, suggests that the correction phase in JasmyCoin (JASMY) is complete. The chart shows a three-wave down pattern, labeled a, b, and c, indicating the end of the correction.
There is a real chance for #JASMY to extend higher, now that the correction appears complete with three waves down. An impulsive five wave rally should now take $JASMY beyond the previous local high of 0.04470 pic.twitter.com/7rCDk17bPZ
— Matthew Dixon – CEO Evai (@mdtrade) July 1, 2024
Following this, a five-wave impulsive structure is visible, marked as 1 through 5. This aligns with Dixon’s prediction of an impulsive rally. He suggests that JASMY has the potential to surpass the previous local high of 0.04470, which is marked on the chart for reference.
JasmyCoin Shows Bearish Momentum on Daily Chart
Examining the daily chart, the Awesome Oscillator (AO) indicates a shift in market momentum. The histogram has changed from green to red bars, signaling bearish momentum. The increasing size of the red bars suggests that bearish momentum is gaining strength. Concurrently, the Relative Strength Index (RSI) stands at 43.33, below the neutral level of 50. This places JASMY in a bearish phase, but not in the oversold territory, which is below 30. Therefore, there may still be room for a further decline before a potential reversal.
The price action on the daily chart shows significant movement, with a strong upward trend beginning in early 2024. This was followed by a consolidation phase and a subsequent downtrend. Volume spikes correspond with significant price movements, indicating robust trading activity during those periods. Currently, the trading volume appears lower compared to previous high trading periods, suggesting reduced market participation.
Weekly Chart Shows Weakening Bullish Momentum
The weekly chart for JASMY/USD reveals substantial upward movement starting in early 2024, followed by a correction. The price peaked around $0.045 before pulling back to the current level of $0.02822. Volume trends show substantial increases during price surges, indicating strong participation. Recently, the volume has decreased, corresponding with the price pullback.
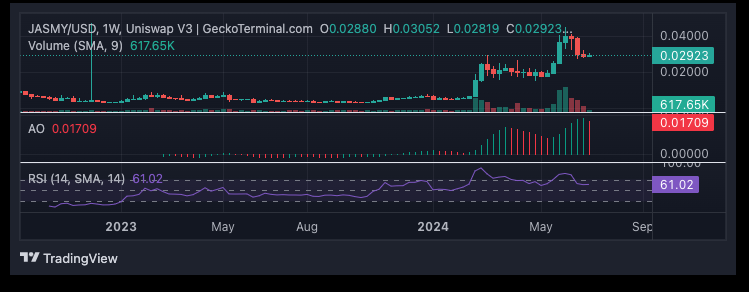
The Awesome Oscillator (AO) on the weekly chart shows bullish momentum, with the histogram displaying green bars. However, the decreasing size of these bars indicates weakening bullish momentum. The RSI on the weekly chart is currently at 59.63, placing it in the neutral to slightly bullish territory. It is above the oversold level of 30 and below the overbought level of 70, suggesting the market is neither overbought nor oversold but leaning slightly bullish.
Overall, the trend on the weekly chart remains bullish but shows signs of weakening momentum. The RSI’s neutral position suggests no immediate threat of a strong reversal. However, traders should monitor for further weakening momentum.
Read More
- Shiba Inu Price Prediction As SHIB Burn Accelerates, Is $0.00003 the Next Stop?
- Best Meme Coins to Watch Closely in July 2024
- DePIN Crypto Projects to Watch In 2024 – Top 10 DePIN Coins
- Best Metaverse Coins to Invest – Next Metaverse Coins

Advertisement


