JasmyCoin Price Slumps 8% Despite Being Among Top Monthly Gainers

Cryptocurrency trading is speculative and your capital is at risk when you trade. We may earn affiliate commissions from some of the products on this page - at no extra cost to you.

The JasmyCoin crypto has slumped 8% to trade for $0.02961 as of 9:15 p.m. EST on an 11% drop in trading volume to $153 million.
Jasmy has been one of the standout altcoins in recent weeks. Despite a dip over the past week, JASMY ranks among the top three gainers for the month by market capitalization. According to Crypto Stars data, Jasmy has a 42% surge, trailing Brett and Notcoin, which saw impressive gains of 168% and 195%, respectively.
Advertisement

Monthly Trending Coins:#NOT – Notcoin gained 195.4%#BRETT – Brett gained 168.1%#JASMY – JasmyCoin gained 42.0%#TON – Toncoin gained 18.6%#XMR – Monero gained 16.4%#KAS – Kaspa gained 15.3%#ORDI – ORDI gained 4.6%#TRX – TRON gained 3.3%#Altcoins #ToTheMoon pic.twitter.com/vdCHqDMMwb
— Crypto Stars (@CryptoStarsApp) June 23, 2024
JasmyCoin is the native token of the Japan-based Jasmy platform, designed to help users control and monetize their personal data. Data from IoT devices like smartphones and wearables is securely stored in data lockers on the platform. Merchants pay for access to these data lockers using JasmyCoin.
JASMY Price Statistics
- Jasmycoin Price: $0.02961
- Market Capitalization:$1.42 billion
- Trading Volume: $153 million
- Circulating Supply:48 billion
- Total Supply:50 billion
JasmyCoin Price Continues To Tumble: Can The Bulls Regain Momentum?
The price of JasmyCoin has been on a downtrend since reaching its peak at $0.04468. The ongoing battle between buyers and sellers has resulted in the formation of a bearish channel, reinforcing the current downward trend.
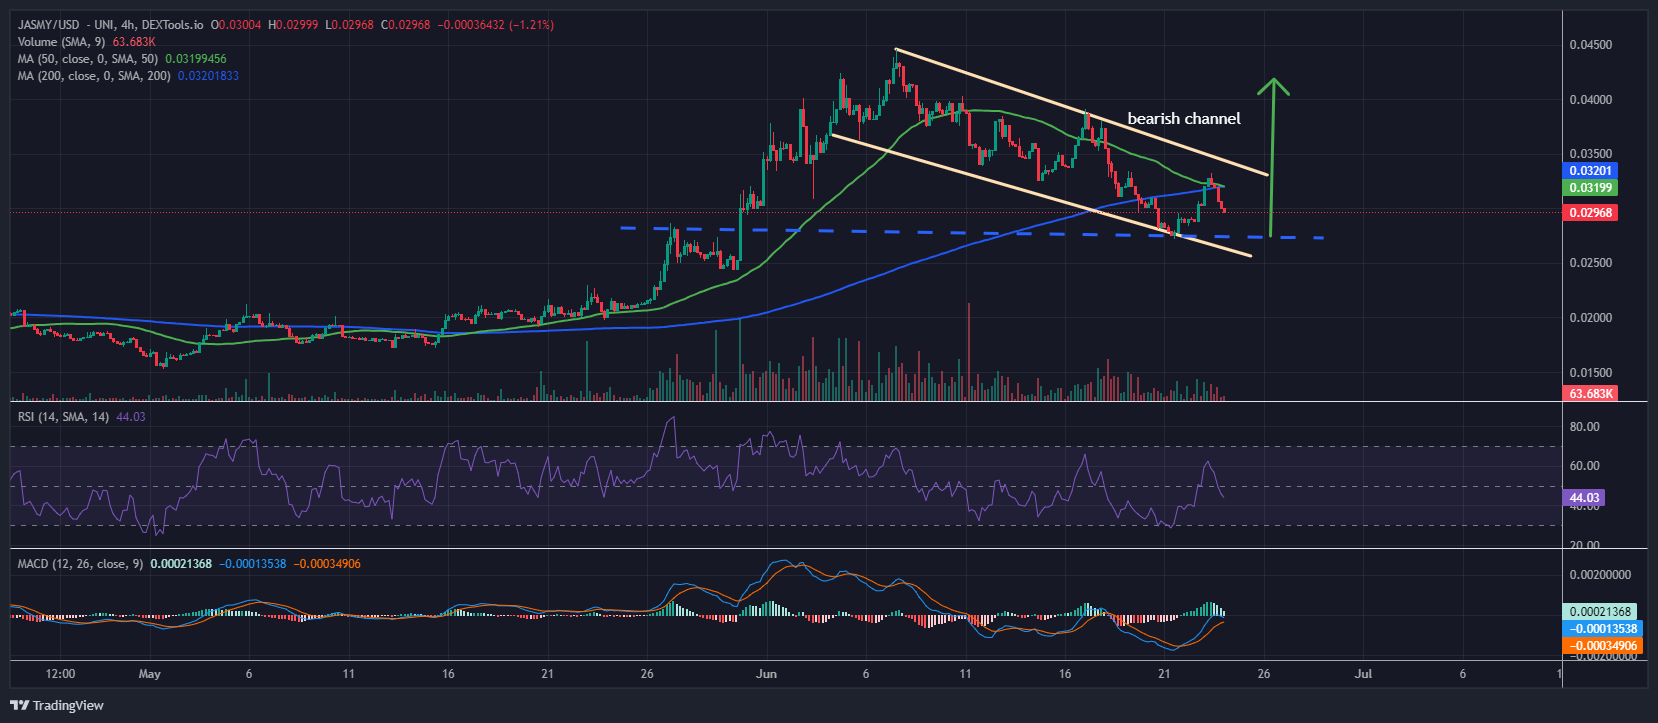
JASMYUSD Analysis (Source: Dextools.io)
JasmyCoin (JASMY) recently rebounded off the 50-day Simple Moving Average (SMA) at $0.032, indicating that sellers still maintain control over the price. This bearish movement suggests that the price could potentially drop further, heading towards the channel’s lower trendline.
Analyzing the JASMY/USDT daily chart shows that the price is trading below the 200-day SMA, reinforcing the bearish sentiment. The 50-day SMA also approaches a downward cross above the 200-day SMA, commonly called a “death cross.” This technical pattern often signals the continuation of a bearish trend.
However, if buyers can muster enough strength to break through the resistance at the 200-day SMA, there is potential for a rally, with the price possibly reaching up to $0.04.
The Relative Strength Index (RSI) is trending downwards near the midpoint of 50. This indicates that selling pressure is easing, and buyers may prepare to enter the market. Should the RSI rebound and surge towards the overbought zone (above 70), it would signal intense buying pressure and a possible upward movement for JASMY.
On the other hand, the Moving Average Convergence Divergence (MACD) shows signs of a potential rebound from the bottom. The blue average line has crossed above the orange signal line, a bullish indicator suggesting that positive momentum may be building. However, the average and signal lines must cross above the neutral (zero) point for a confirmed bull rally.
Despite the positive crossover, the diminishing green bars on the histogram suggest that the bullish momentum might weaken. The bearish trend might continue if the MACD fails to cross the neutral point.
Final Thought
On the 4-hour chart, bears are already pushing the price downwards, but they face support at the lower downtrend line of the channel. If the price rebounds on this level, the bulls could shine on it, driving the price up to breaking above the bearish channel and potentially pushing the pair to $0.04150
Conversely, if bears continue the corrective phase below the 200 SMA, the key support to watch will be at $0.02746. A breach below this level could intensify selling pressure, possibly costing the pair $0.02.
Learn More
- U.S. Government Clarifies Cryptocurrency Regulations
- 20 Top Cryptocurrencies to Watch for 2024 – Detailed Reviews
- DePIN Crypto Projects to Watch In 2024 – Top 10 DePIN Coins to Buy
- Next Cryptocurrency to Explode in 2024
Disclaimer: Cryptocurrency is a high-risk asset class. This article is provided for informational purposes and does not constitute investment advice. You could lose all of your capital.


Advertisement


