Is It Too Late to Buy Solana? SOL Price Surges 2% as the Bulls Target $160 Level


The Solana price is in focus today, as it has jumped 2%, with SOL/USD trading at $143. The hype surrounding the Brazilian Securities and Exchange Commission’s (CVM) approval of the Solana spot exchange-traded fund (ETF)has had a noticeable positive impact on SOL. Moreover, its trading volume has surged 15% to $1.99 billion in the past 24 hours.
Second Solana ETF Approval in Brazil
The Brazilian Securities and Exchange Commission (CVM) recently approved a second Solana exchange-traded fund (ETF). According to the CVM database, the new Solana (SOL) ETF, which is in a pre-operational phase, will be offered by Brazil-based Hashdex.
Advertisement

1/5
Solana ETFs have gained progress in Brazil recently.
On Wednesday, Aug. 21, a second Solana ETF, managed by Hashdex,
Received the green light from the Brazilian Securities Commission (CVM). pic.twitter.com/q01xw4yT1b
— Ryu (@_RYUMETA) August 22, 2024
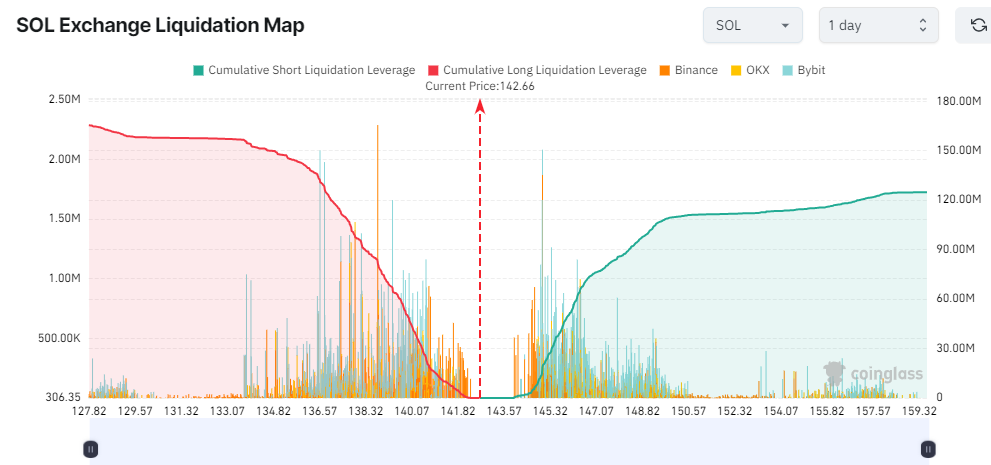
Hashdex is a Brazil-based asset manager with over $962 million in assets under management. Moreover, Hahdex will partner with the local investment bank BTG Pactual. The first SOL ETF was approved in early August. Meanwhile, data from Coinglass suggests that many traders betting on Solana price surges have liquidated long positions, increasing the probability of another upswing to $160.
Solana Price Statistical Data
Based on CoinmarketCap data:
- SOL price now – $143
- SOL market cap – $66.87 billion
- SOL total supply – 582 million
- SOL circulating supply – 466 million
- SOL ranking – #5
The Solana price has been in a consolidation phase for weeks as the bulls search for liquidity, which could trigger an uptrend. Yesterday, an attempt to break above $150 was rejected, forcing the bulls to reassess before a potential strong leg up. As traders and investors expect a rebound from the $142 support level to around $160, it could trigger a buying frenzy in the market.
Will the Bulls Strike an Upswing?
The technical outlook shows that the bulls have turned the 50-day Simple Moving Average (SMA) (green) into support at $142. However, with a tug-of-war between the bulls and bears in the market, will SOL break out to $160? Meanwhile, the $158 level, which coincides with the 200-day SMA, acts as a cushion against upward movement.
Moreover, the Relative Strength Index(RSI) is at equilibrium, at 50 mean level. The RSI at a neutral level shows a tussle between the buyers and sellers, with each trying to take control of the market.
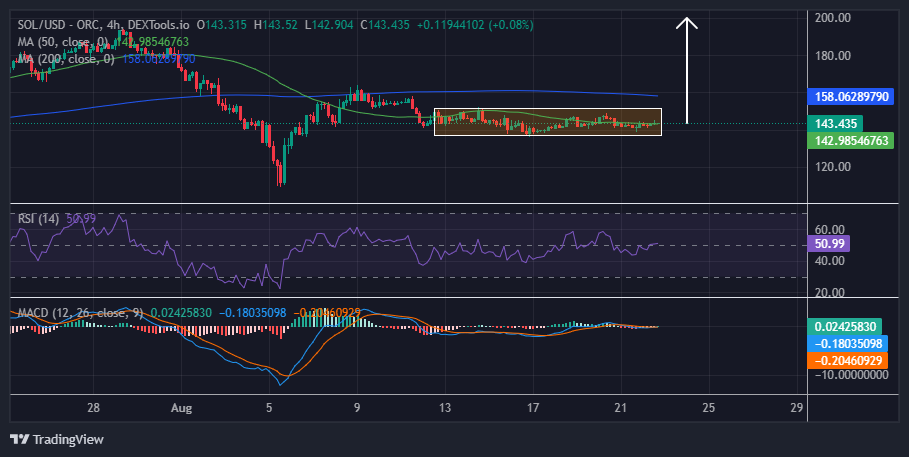
On the other hand, the Moving Average Convergence Divergence (MACD) upholds a bullish outlook. The MACD indicator has flipped above the orange signal line, calling for traders to buy more SOL. As the momentum indicator gradually ascends above the mean line (0.00) into the positive region, the path with the least resistance stays on the upside.
What Next for Solana Price?
According to the 4-hour chart analysis, neither the bulls nor the bears have control, suggesting that the market is neutral. However, the bulls could take advantage of the MACD indicator, which calls for traders to rally behind SOL. With enough liquidity to resume the uptrend, the SOL price could surge. A strong leg up to $160 will call for more buying as the bulls could flip the $158 resistance into the support floor.
Such a move could initiate broader market FOMO, elevating Solana toward the $180 and even the $200 level. On the flip side, a breach and break below the $142 support zone would suggest increased selling pressure. In such a case, another swing low to around the $130 support area is possible before Solana reverses the trend.
Advertisement


Emmaculate Araka
Emmaculate Araka is a cryptocurrency writer with published works on Crypto2Community and other news sources. She is believer in the transformative power of crypto and the blockchain industry, conducting on-chain analysis, breaking down market-triggering events, and helping traders and investors benefit from expert technical price analysis. Emmaculate finds gratification in diving deep into the crypto space, earning herself significant knowledge and experience. She holds a Bsc. in Information Science, and outside work, Emmaculate loves reading novels and watching documentaries.
View full profile ›ℹ️About Crypto2Community's Editorial Process
Crypto2Community's editorial policy is centered on delivering thoroughly researched, accurate, and unbiased content. We uphold strict editorial policy and sourcing standards, and each page undergoes diligent review by our team of top crypto industry experts and seasoned editors. This process ensures the integrity, relevance, and value of our content for our readers.