


The Solana price prediction is in focus today, as the token is down by 1%, raising concerns about potential further selling. Over the past week, Solana recorded a significant outflow exiting the network. With SOL/USD currently trading at $142, the recent movements and technical indicators suggest a bearish outlook, highlighting key resistance and support levels crucial for traders to monitor.
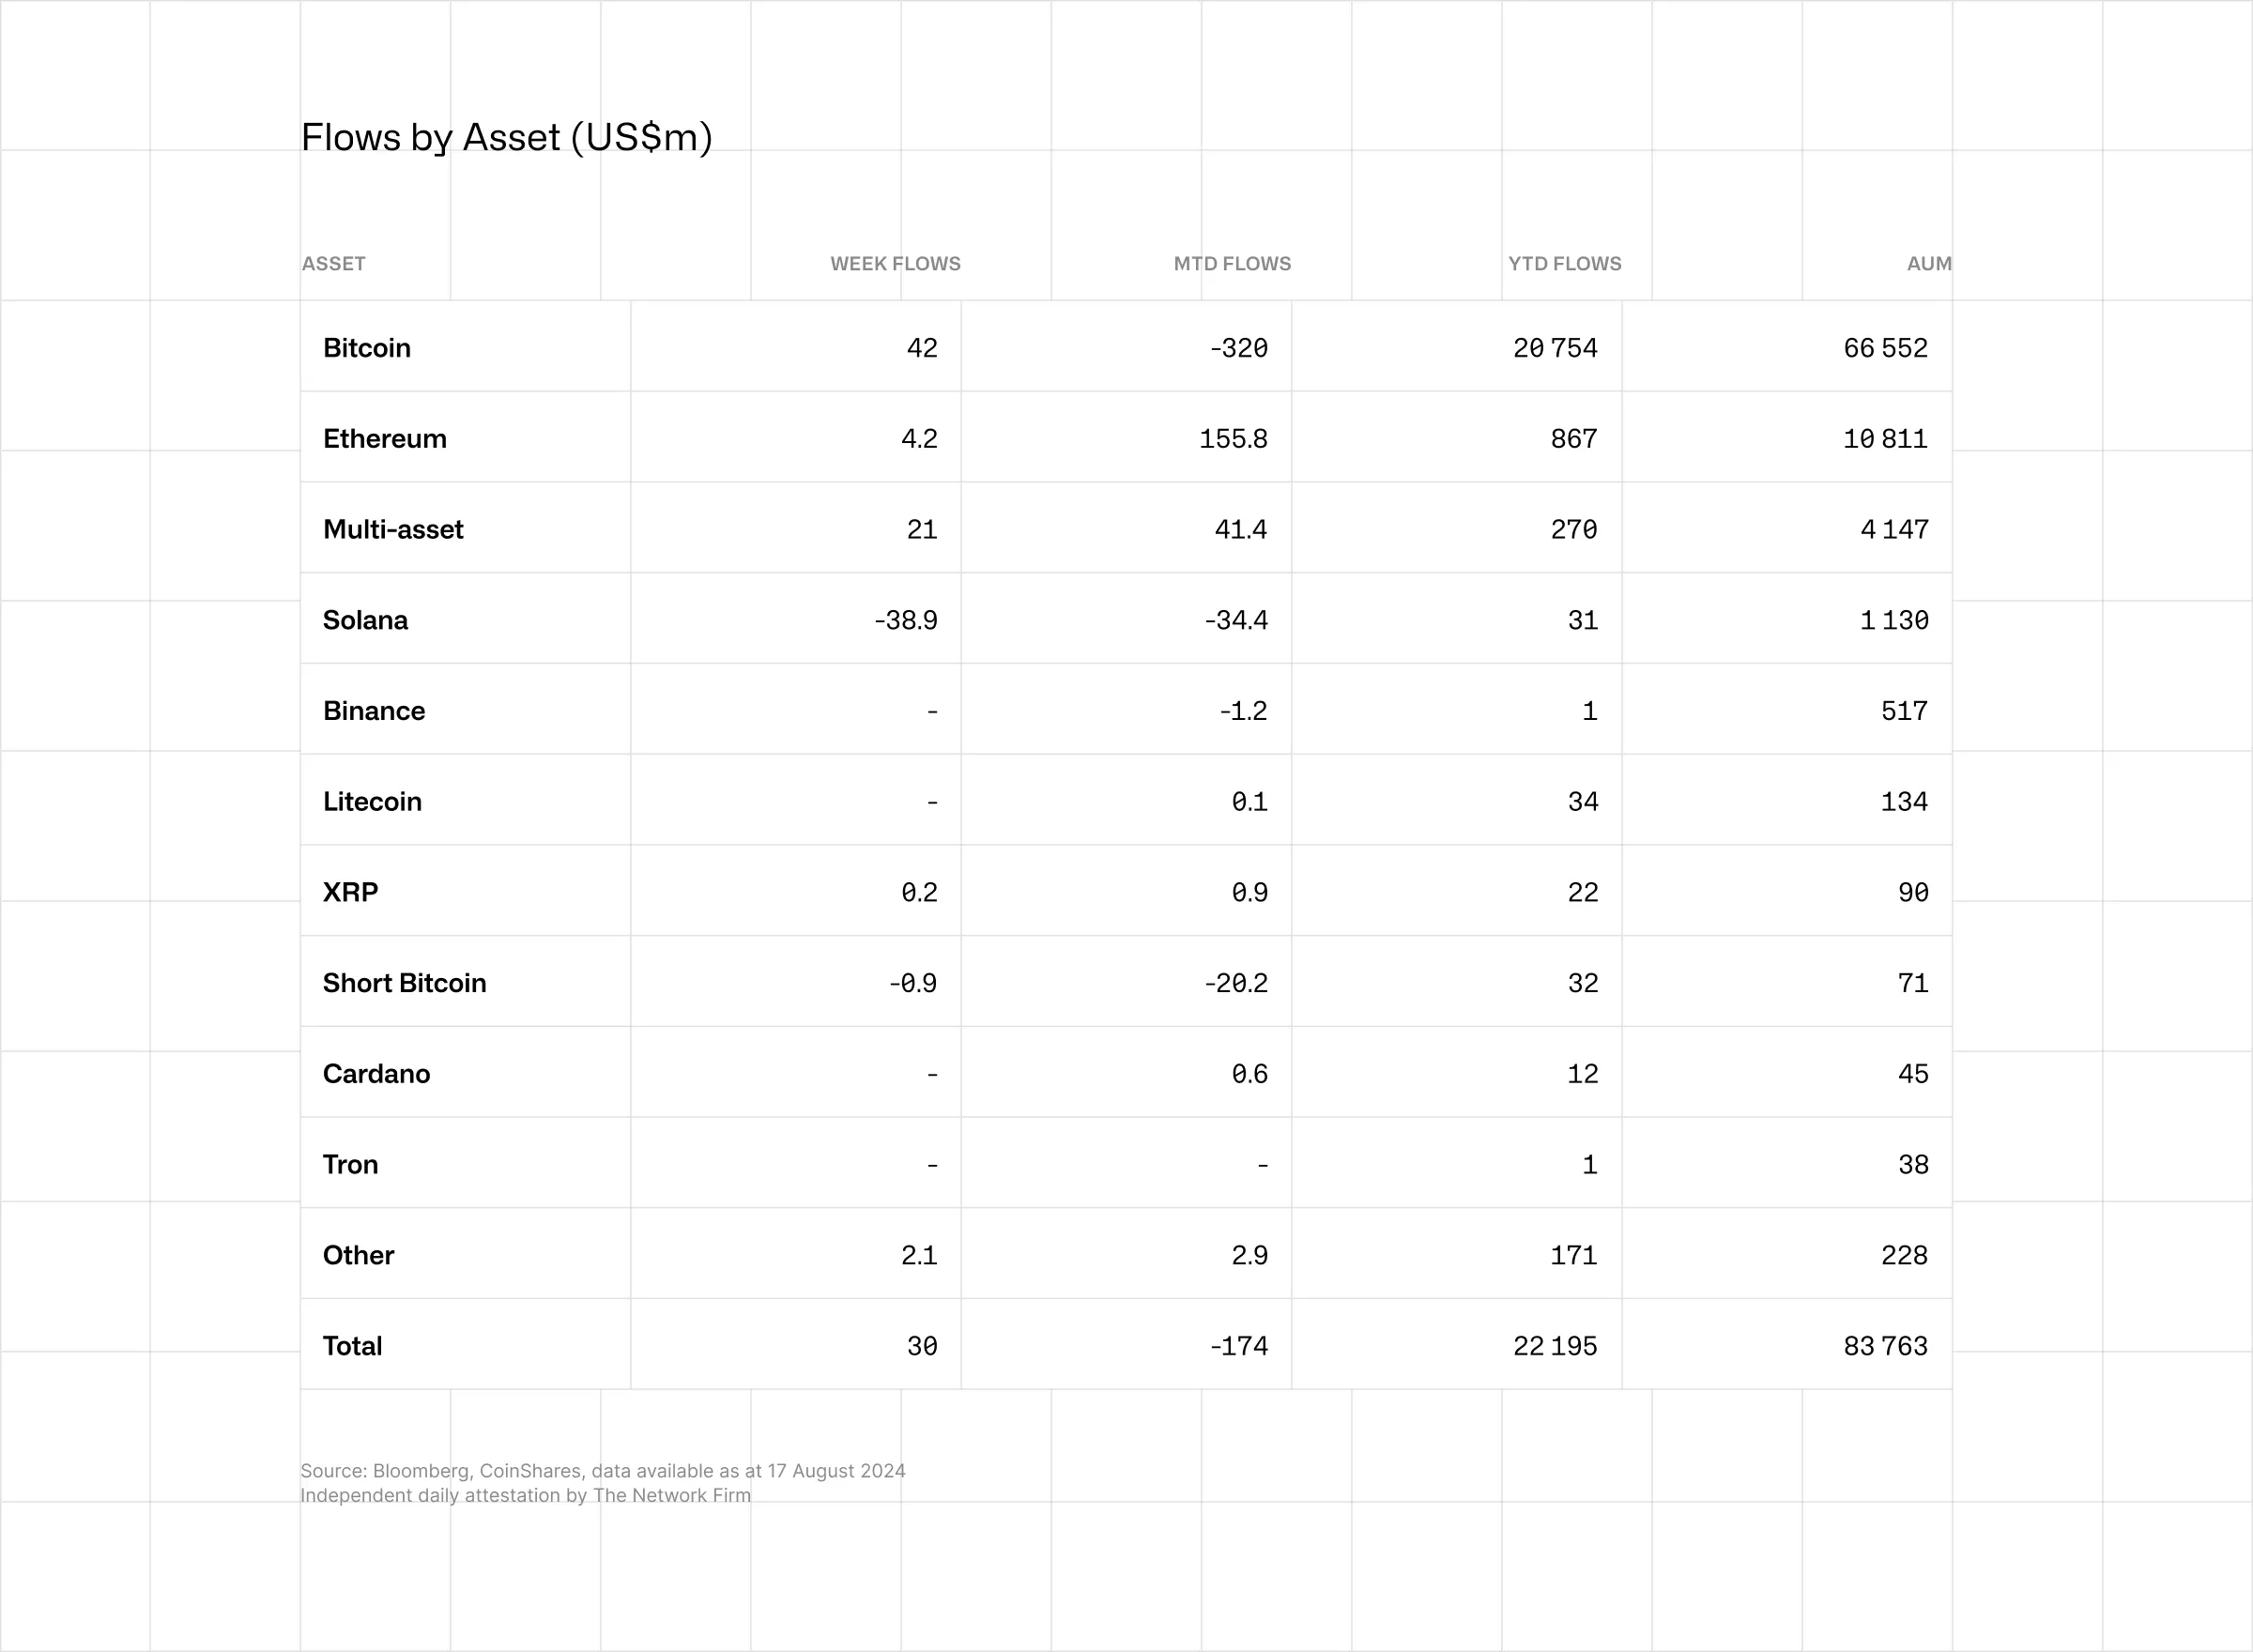
Meanwhile, data from Coinshares shows that last week, digital asset investment products experienced minor inflows totaling US$30m. This comes as recent macroeconomic data suggested that the Fed was less likely to cut interest rates by 50 basis points in September.
Advertisement

Bitcoin saw the most significant inflows, totaling US$42m, while short-bitcoin ETFs saw outflows for the second consecutive week, totaling US$1m. On the other hand, Ethereum saw only US$4.2m inflows. However, this figure conceals a flurry of activity, with newer providers attracting $104 million in inflows, while Grayscale experienced $118 million in outflows. Solana saw the most significant outflows of US$39m, the largest on record, as it faced a sharp decline in trading volumes of memecoins, on which it heavily relies.
Solana Statistical Data
Based on CoinmarketCap data:
- SOL price now – $142
- SOL market cap – $66 billion
- SOL total supply – 582 million
- SOL circulating supply – 466 million
- SOL ranking – #5
Solana Price Aims for a Breakout
The Solana price has been on a tear since 11 August, as the $137 level acted as a cushion that the bulls capitalized on, attempting to break out. This has resulted in a rectangular pattern as the bulls aim to flip the 50-day SMA into the support floor. In the 4-hour chart timeframe, the technical outlook suggests bearish prospects in the Solana market.
To begin with, the Solana price is below the two key indicators: the 50-day Simple Moving Average (SMA) (green) and the 200-day SMA (blue). In this case, the $144 and $159 resistance levels must be broken for bulls to resume the uptrend.
The Relative Strength Index (RSI) upholds a bearish outlook as it hovers below the 50-mean level. It currently sits at 49, tilting the odds toward the Bears. Moreover, if the bulls increase their buying appetite at this level, the RSI could jump to the 70-overbought zone.
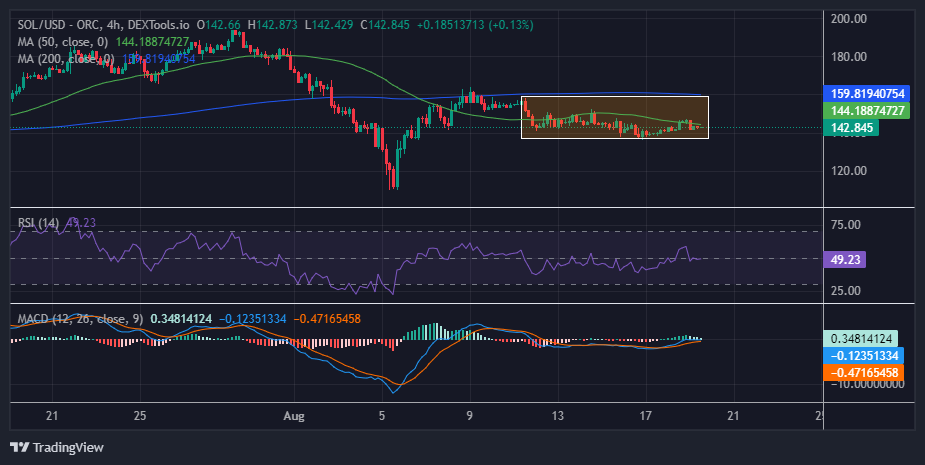
On the other side of the fence, the Moving Average Convergence Divergence (MACD) introduces a new bullish outlook on the four-hour chart. A buy signal manifested when the blue MACD line flipped above the orange signal line. This reveals that traders and investors are inclined to buy Solana unless the MACD changes. Moreover, if the blue MACD line keeps the gap above the signal line intact, a recovery will soon resume as traders return to seek exposure to SOL longs.
SOL Price Prediction
According to the 4-hour chart analysis, there is a tug-of-war between the bulls and the bears in the Solana market. However, if the bulls gain momentum at this level and capitalize on the MACD indicator, which suggests a buy signal, the Solana price could surge. In such a case, increased buying appetite will see the bulls flip the $144 resistance into the support floor, targeting the next resistance at $159.
In a highly bullish scenario, the bulls could flip the 200-day SMA into support, propelling the price to $180 in the coming weeks. Conversely, a rectangle pattern formed on the chart could invalidate the uptrend in favor of a downside breakout to $137. If more traders switch to short SOL, the down leg may stretch to $128.
Advertisement


