Is It Too Late To Buy SOL? Solana Surges 4% As It Becomes The Leading NFT Blockchain

Cryptocurrency trading is speculative and your capital is at risk when you trade. We may earn affiliate commissions from some of the products on this page - at no extra cost to you.

The Solana price is trading with a bullish bias, as its recent price movements and technical indicators suggest an upward trend despite a slight retracement. With SOL/USD trading at $146, a 4% surge today, its trading volume has also jumped 39% to $1.7 billion, showing intense market activity.
This comes as Fabiano, a well-known content creator, took to the X platform, hinting at the possible comeback of NFTs. The graphics showed the floor price changes in SOL for the past 24 hours.
Advertisement

Gm 💚
Are NFTs back?
Disclaimer: Graphic shows floor price changes in SOL (24 hours) pic.twitter.com/ckXBdtcY8w
— fabiano.sol (@FabianoSolana) July 1, 2024
Notably, data from CryptoSlam.io, an on-chain crypto market data aggregator, shows that NFT collections created on Solana have made a huge comeback.
In the past 24 hours, Solana-based NFT collections have amassed a trading sales volume of $6.68 million, representing an 89% surge.
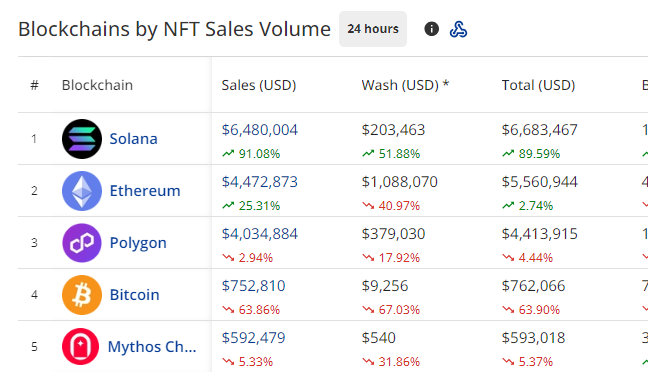
This has driven Solana to the top position, making it the leading blockchain network in the NFT ecosystem.
Solana Statistical Data
Based on Coinmarketcap data:
- Solana price now – $146
- Solana market cap – $67.91 billion
- Solana total supply – 4579.22 million
- Solana circulating supply – 462.67 million
- Solana ranking – #5
Solana’s price is hovering around the $146 mark, grappling with a persistent downtrend and an unstable crypto market. Despite a recent surge, the coin struggles to maintain upward momentum as the bears try to enter the market.
However, the Solana price is trading with a bullish bias. On the 4-hour chart timeframe, the SOL/USD trading pair is consolidating within an ascending triangle pattern. This technical chart pattern is considered a continuation of a bullish sentiment as the price hurtles toward breaking above the upper trend line.
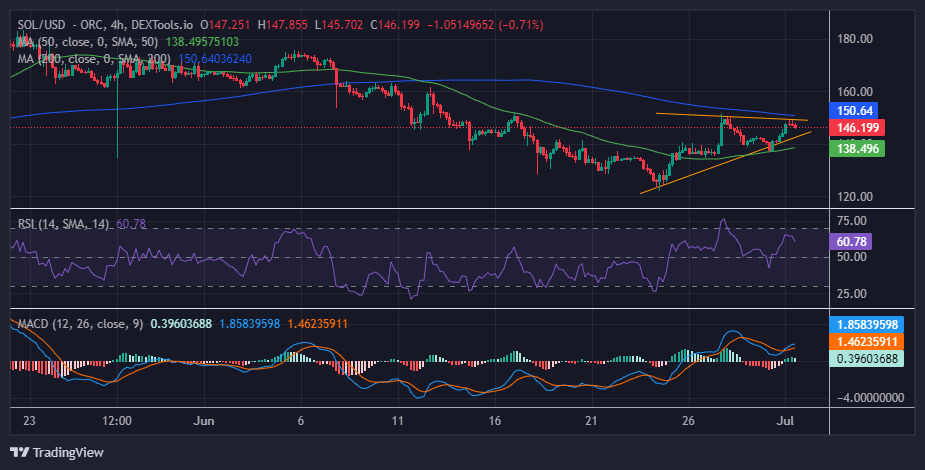
The Relative Strength Index (RSI) reinforces the bullish thesis, showing that the bulls are leading the SOL market. This is supported by its position well above the mean level of 50, currently at 60, tilting the odds to the buyers.
Moreover, the Moving Average Convergence Divergence (MACD) position is in positive territory, supporting the bullish trend. The blue average line has crossed above the orange signal line at the neutral level, indicating a shift toward bullish momentum. Furthermore, the histogram bars flash green in price movement, bolstering the positive sentiment for SOL.
Despite slight retracement, SOL indicates a surge above the 50-day Simple Moving Average (SMA), breaking out of the lower trendline. This shift in momentum suggests an upward trend, with bulls driving the price higher in hopes of reaching a new all-time high. A further push could see the price surpassing the 200-day SMA, which is currently a significant resistance level.
Solana Price Prediction
Solana’s technical outlook suggests the potential for further gains as long as the price remains above the $138.49 support level. Moreover, the token is set for a sustained bullish stance over the governing pattern as the bulls target the recent high mark of around $209.
Additionally, increased bullish momentum could surge the price, with bulls breaking the major technical barrier of $150 to its ATH of $209.
Conversely, the bullish thesis would be invalidated if the bears are aggressive and the overall crypto market outlook is negative. In such a scenario, the bears will gain control if the SOL price slumps below the $138 support level.
Advertisement


