


The Render price is riding on the wave of the broader crypto market, which is flashing bearish. The token is down 7%, with the RENDER/USD trading at $6.01 at press time. Worsening the outlook is its 24-hour trading volume, which has slumped 65% to $11 million, suggesting dwindling market activity among traders and investors.
The sharp decline in Render price comes as whales’ sell-off triggered a plunge effect, impacting short-term traders and shaking long-standing holders’ faith. Addresses holding between 1 million and 10 million RENDER have sold nearly 30 million RENDER worth over $191 million. This offloading occurred within the last week, triggering the Render price movement.
Advertisement

⚡️ HINTS: #RENDER Price Drops as Whales Sell 30 Million Tokens in a Week
Render price trading at $6.5 is struggling to reclaim $7.0 as a support floor.
Whale addresses have sold nearly 30 million RENDER in the last one week.#CryptoInvestor #CryptoInvesting #CryptoMarketing… pic.twitter.com/ocinp9uNCV— cryptub (@cryptubworld) July 24, 2024
Meanwhile, data from Coinglass indicates that long-term holders are beginning to liquidate their positions. This move suggests a lack of faith in the token’s ability to recover soon.
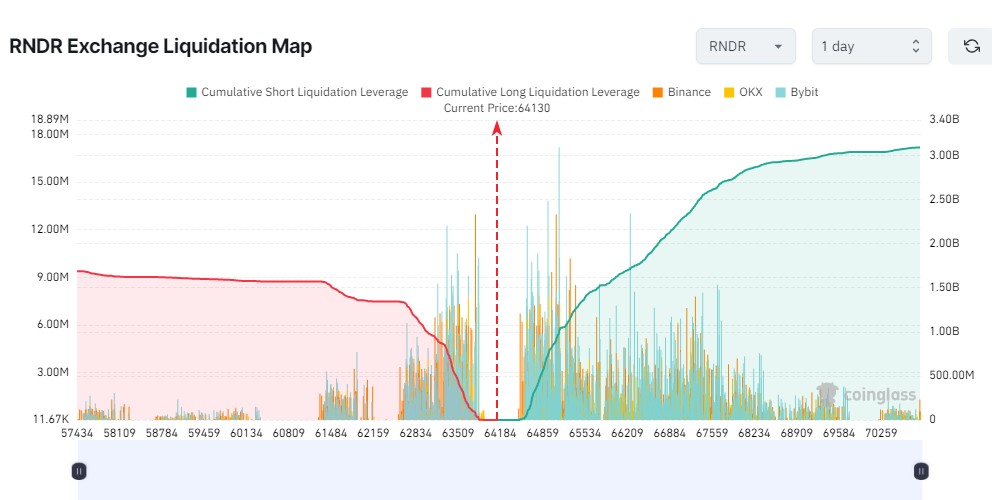
The short positions in RENDER are comparably higher than the long positions. This comparison suggests dwindling buyer momentum, as the market sentiment paints a bearish outlook.
Render Statistical Data
Based on Coinmarketcap data:
- RENDER price now – $6.01
- RENDER market cap – $2.58 billion
- RENDER total supply – 532 million
- RENDER circulating supply – 392 million
- RENDER ranking – #32
The Render token has flipped bearishly within a falling channel. The bears have capitalized on the death cross, which is formed at $6.69, causing the Render price to drop consistently. At the time of writing, the token dipped to a daily low of around $6.00. However, it remains to be seen whether reaching this short-term price bottom will trigger the bulls to buy the dip.
Render Price Technical Indicators Warn That the Token Might Keep Dropping
The technical outlook paints a bearish picture, as the Render price trades below the 50-day and 200-day Simple Moving Averages(SMA). In this scenario, the sellers have the upper hand as the $6.31 and $6.63 act as a cushion against upward movement.
Moreover, the Relative Strength Index (RSI), which currently stands at 35, reinforces the bearish outlook. With the bears dominating the RENDER market, the token may hurtle towards the 30-oversold zone, tilting the odds towards the seller.
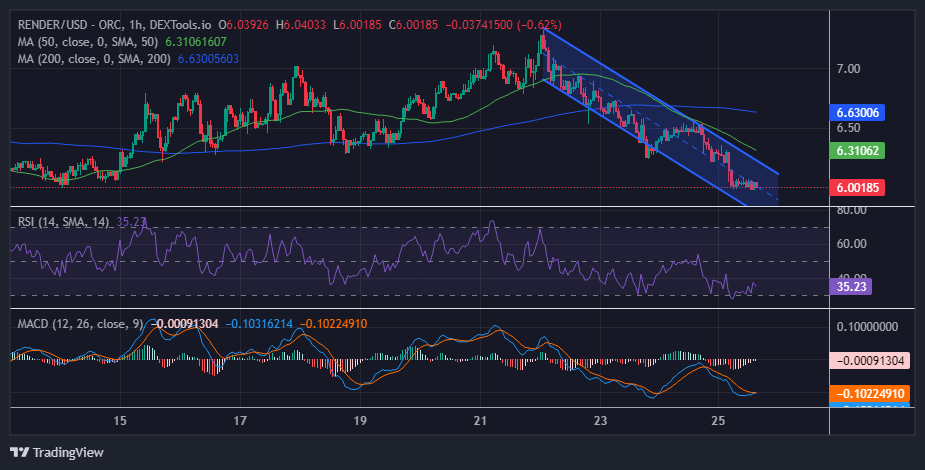
In the same way, the MACD (Moving Average Convergence Divergence) worsens the outlook as it hovers around the negative territory. Moreover, the momentum indicator has crossed below the signal line (orange band), suggesting a shift from bullish to bearish. Meanwhile, the traders and investors are inclined to sell unless the MACD signal changes.
Will the Bulls Pose a Recovery in the RENDER Market?
In the 1-hour chart analysis, the sellers dominate the market, sending the token price downward. With the RSI and MACD suggesting intense selling pressure, the RENDER price may continue dropping if the bulls won’t enter the market. However, if the bears continue with the selling pressure, the RENDER token could potentially hurtle below the channel’s lower trendline. In such a case, the token may retest a low of $5.70, an intra-day low recorded on July 12.
Conversely, if the bulls initiate a buy-back campaign at this level, the Render price might surge to $6.55, invalidating the bearish sentiment. In a highly bullish case, the bulls might flip the 50-day SMA into support, sending the token’s price to its ATH at the $7.30 mark.
Advertisement


