Highlights:
- Amp price is up 12% to $0.0051 as volumes surged 1158% in the last 24 hours.
- The crypto analyst has predicted a possible surge in the Amp price to $0.0704.
- Overbought conditions are being demonstrated for technical indicators, and therefore, a correction is likely.
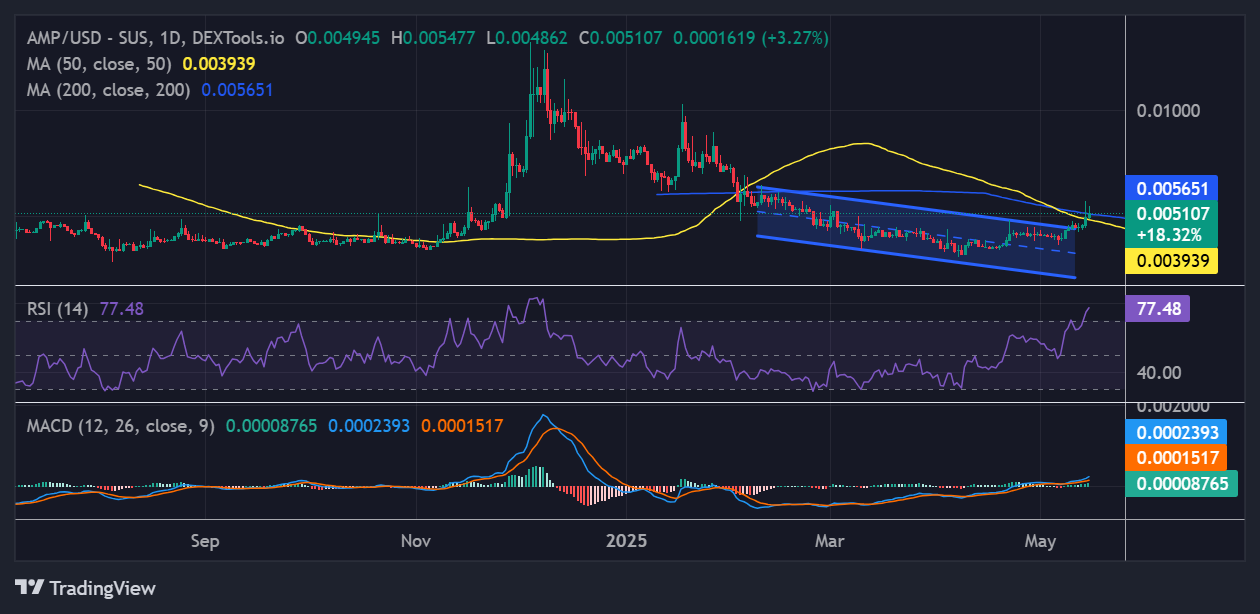
Amp price has proved to have massive strength with massive gains in just a day’s time, where it has gone up by approximately 12% to trade at $0.0051. Though the crypto market is in a retracement state, the AMP price has skyrocketed out of the $0.0044 lows to above the $ 0.005 level. With its daily trading $171.21M increased 1158% that translates to higher market activity. This recent development in the AMP market indicates high buying demand, which boosts investors’ confidence.
AMP Price Outlook
The AMP price refuses to weaken as the bulls refuse to give up. This has rendered the bears completely in the dust, as bulls eye the next significant barrier at the $0.0056 level. From the price action confirmation with the $0.0039 matching the 50-day MA flipped into support, the bulls have the momentum to move up to the next immediate barricade. If the support zone holds, bulls might hit $0.0056 at a short term. The bullish mood might take the AMP price up to $0.0061.
At the same time, with all the good feelings surrounding the token, the analysts remain optimistic about further upward movement. Javon Marks, one of the analysts, has pointed out through an X post that ‘’ a massive wave up towards the $0.07048 target could be in the works.’’
$AMP adds nearly +20% to its prices!
A massive wave up towards the $0.07048 target could be in the works… https://t.co/uZD6VRJoxV
— JAVON⚡️MARKS (@JavonTM1) May 14, 2025
The AMP technical indicators point the other way of a possible retracement. First, the Relative Strength Index has climbed to the 77-overbought region with a warning of a possible correction.

Furthermore, the Moving Average Convergence Divergence (MACD) indicates a buy signal. This is evidenced by the blue MACD line crossing above the signal line. Markedly, the favorable stand above the neutral zone confirms the bullish nature of the market. It means that traders can buy more AMP tokens unless the MACD is altered.
AMP Derivatives Data
From a closer look at Amp derivatives analysis, one can say that the volume has spiked over 800% to $8.37M, which shows intensive activity on the market. However, its open interest has declined 7% to $1.24M, which means traders are eliminating their positions.
In other words, this is also an indicator of a declining trend or even of a correction in the AMP price. Moreover, the AMP’s long-to-short ratio is 0.9524, which is less than 1. This implies some bearish potential on the AMP market, as long as the bulls fail to maintain the pace.

On the negative side, the overbought status of the Amp price puts a correction in the picture. What is more, a sharp decline of the token is possible if the $0.0056 resistance is too strong to hold. In this kind of case, the $0.0049 instant support will provide instant support. If this zone breaks, the Amp price may retest the major support level at $0.0044, which could possibly accommodate the speculated sell-off pressure. A crack below the same level will require additional downside, to $0.0042 and $0.0039.
Best Crypto Exchange
- Over 90 top cryptos to trade
- Regulated by top-tier entities
- User-friendly trading app
- 30+ million users
eToro is a multi-asset investment platform. The value of your investments may go up or down. Your capital is at risk. Don’t invest unless you’re prepared to lose all the money you invest. This is a high-risk investment, and you should not expect to be protected if something goes wrong.


