


The XRP price is in focus today as it has plummeted 2%, with the XRP/USD trading at $0.57. Despite the slight plunge, its 24-hour trading volume has surged 51% to $1.64 billion, suggesting intense market activity among traders and investors.
Meanwhile, Ripple token whales have scooped up over 50 million XRP in the past 24 hours, boosting their holdings by approximately $29.5 million.
Advertisement

#Ripple whales have scooped up over 50 million $XRP in the past 24 hours, boosting their holdings by approximately $29.5 million! pic.twitter.com/nqNMG2J5Ng
— Ali (@ali_charts) August 27, 2024
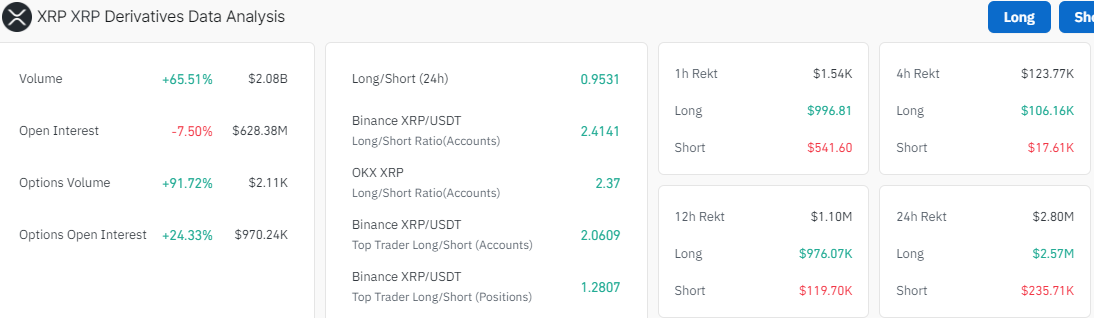
Nonetheless, data from Coinglass shows a slight dwindle in Open interest by 7% to $628.38 million. Open interest measures the number of outstanding contracts in the futures or options market, indicating market participation and potential for liquidity. However, XRP’s volume has increased 65% to $2.08 billion, offering insights into immediate market activity.
XRP Statistical Data
Based on CoinmarketCap data:
- XRP price now – $0.57
- XRP market cap – $32 billion
- XRP total supply – 99 billion
- XRP circulating supply – 56 billion
- XRP ranking – #7
Is A Rebound to $0.60 Possible?
The XRP price signals a bullish move above the $0.60 resistance zone. At the end of July, the whales dived into a buying frenzy, which saw the XRP token surge to $0.65. However, various investors were reluctant to increase their holdings as the crypto market experienced a crash, sending XRP to $0.45.
Moreover, the recent ruling in the US Securities Exchange Commission (SEC) against Ripple activated a buying spree in the market. Many viewed the decision as a major win for Ripple, while XRP price briefly surged to $0.64. Meanwhile, the token experienced additional volatility before settling at its current level of around $0.57.
Diving into the technical analysis, the XRP price trades within the confines of a falling wedge and staggers below the bullish indicators. To start with, it trades below the 50-day and 200-day Simple Moving Averages (SMAs), with immediate resistance at $0.58 and $0.59, respectively. However, the bulls show resilience as they strive to flip the $0.58(which coincides with the 200-day) resistance into the support zone. If the bulls achieve that tussle, they might grow hind wings and target the next resistance at $0.59.
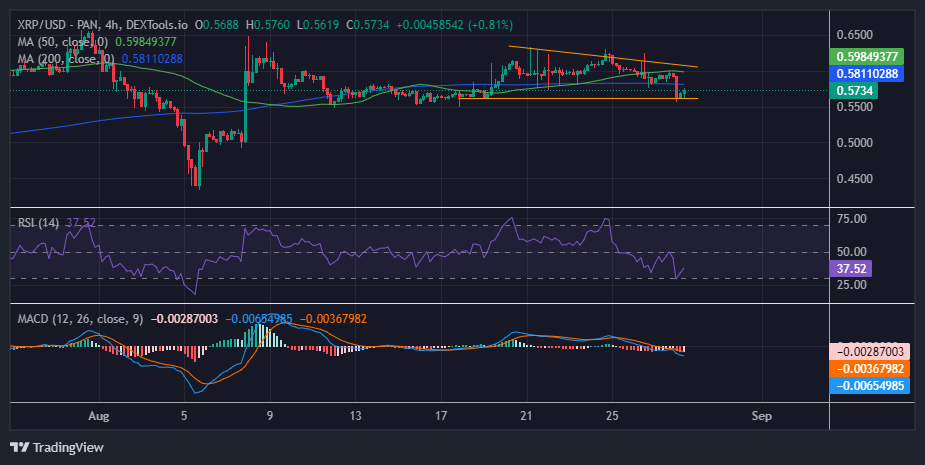
Moreover, the Relative Strength Index has hurtled from the 30-oversold zone, currently at 37. With the token roaming around the undervalued region, the bulls might initiate a buy-back campaign, which could cause the RSI to jump above the 50-mean level. Notably, there is more room for potential upside before XRP is considered overbought.
On the other fence, the Moving Average Convergence Divergence (MACD) upholds a bearish outlook. This is evident as the MACD indicator (blue) has crossed below the orange signal line, shifting the momentum from bullish to bearish.
XRP Price Outlook
According to the 4-hour chart above, the odds tilt in favour of the sellers. If the bears dominate at this level, the XRP price will drop. While the levels between $0.60 and $0.57 remain critical to watch, only a slip below $0.56 will trigger a sell-off.
Conversely, if the buyers increase their buying appetite at thi level, the XRP price could surge. If the bulls flip the $0.57 resistance into support, the bulls might target the next key resistance at $0.60. However, traders looking to take long positions on the Ripple token should consider waiting for the XRP price to break and close above $0.59.
Advertisement


